文章目录
- 1. hello_world.py
- 2. hello_fields.py
- 3. sync_timing.py
- 4. disksnoop.py
- 5. hello_perf_output.py
- 6. bitehist.py
- 7. vfsreadlat.py
- 8. urandomread.py
- 9. strlen_count.py
- 10. nodejs_http_server.py
- 11. task_switch.c
- 12. 监视 do_execve
1. hello_world.py
from bcc import BPF
BPF(text='int kprobe__sys_clone(void *ctx) { bpf_trace_printk("Hello, World!\\n"); return 0; }').trace_print()
- text=‘…’:定义一个inline BPF 程序. 这个程序使用C语言编码风格。
- kprobe__sys_clone(): 这是通过kprobe进行内核函数动态跟踪的快捷方法。如果C语言函数名称以"kprobe__"作为前缀,则函数名其余部分则表示将要被跟踪的内核函数接口(名), 在我们这里的场景中就是跟踪内核函数sys_clone().
- void *ctx: ctx本来是具体类型的参数, 但是由于我们这里没有使用这个参数,因此就将其写成void *类型。
- bpf_trace_printk(): 一种将信息输出到trace_pipe(/sys/kernel/debug/tracing/trace_pipe)简单机制。 在一些简单用例中这样使用没有问题, but它也有一些限制:最多3 参数; 第一个参数必须是%s(即字符串);同时trace_pipe在内核中全局共享,so 其他并行使用trace_pipe的程序有可能会将trace_pipe的输出扰乱。 一个更好的方式是通过BPF_PERF_OUTPUT(), 稍后将会讲到。
- return 0;:必须这样,返回0 (如果要知道why, 参考 #139 https://github.com/iovisor/bcc/issues/139)。
- trace_print(): bcc提供的一个功能用以读取trace_pipe的内容输出到终端。
# ./examples/hello_world.py
            bash-13364 [002] d... 24573433.052937: : Hello, World!
            bash-13364 [003] d... 24573436.642808: : Hello, World!
[...]
2. hello_fields.py
python">from bcc import BPF

# define BPF program
prog = """
int hello(void *ctx) {
    bpf_trace_printk("Hello, World!\\n");
    return 0;
}
"""

# load BPF program
b = BPF(text=prog)
b.attach_kprobe(event=b.get_syscall_fnname("clone"), fn_name="hello")

# header
print("%-18s %-16s %-6s %s" % ("TIME(s)", "COMM", "PID", "MESSAGE"))

# format output
while 1:
    try:
        (task, pid, cpu, flags, ts, msg) = b.trace_fields()
    except ValueError:
        continue
    print("%-18.9f %-16s %-6d %s" % (ts, task, pid, msg))
- prog =: 这一次我们将C程序定义为了变量,后续通过引用这个变量的方式来使用。如果你想根据命令行参数来进行一些字符串替换,这种方式就很有用。
- hello(): 我们定义了一个C语言函数而非kprobe__ 快捷方式,稍后我们将会引用这个函数。所有声明在BPF程序中的C函数在跟踪函数的kprobe会被执行,因而这里的C函数需要一个pt_reg* ctx类型的首参。如果你想定义一些helper函数,但是又不希望这些函数在probe时就执行,那么需要将这些helper函数定义为static inline 这样编译器可以将其编译为inlined属性; 有时候也许你需要使用_always_inline 函数属性来实现这一效果。
- b.attach_kprobe(event=b.get_syscall_fnname(“clone”), fn_name=“hello”):为内核的clone系统调用函数添加一个kprobe点, 这样实施后在clone()函数的kprobe会执行我们定义的hello() 函数。也可以多次调用attach_kprobe() 函数在需要跟踪的内核函数的kprobe点插入你定义的kprobe跟踪函数。
- b.trace_fields():从trace_pipe返回一组固定字段。类似于trace_print()这个函数一般只在调试时使用,如果在正式发布的工具中应该使用BPF_PERF_OUTPUT()来代替。
# ./examples/tracing/hello_fields.py
TIME(s)            COMM             PID    MESSAGE
24585001.174885999 sshd             1432   Hello, World!
24585001.195710000 sshd             15780  Hello, World!
24585001.991976000 systemd-udevd    484    Hello, World!
24585002.276147000 bash             15787  Hello, World!
3. sync_timing.py
python">from __future__ import print_function
from bcc import BPF

# 加载BPF程序
b = BPF(text="""
#include <uapi/linux/ptrace.h>

BPF_HASH(last);

int do_trace(struct pt_regs *ctx) {
    u64 ts, *tsp, delta, key = 0;

    // 尝试读取存储的时间戳
    tsp = last.lookup(&key);
    if (tsp != NULL) {
        delta = bpf_ktime_get_ns() - *tsp;
        if (delta < 1000000000) {
            // 时间小于1秒则输出
            bpf_trace_printk("%d\\n", delta / 1000000);
        }
        last.delete(&key);
    }

    // 更新存储的时间戳
    ts = bpf_ktime_get_ns();
    last.update(&key, &ts);
    return 0;
}
""")

b.attach_kprobe(event=b.get_syscall_fnname("sync"), fn_name="do_trace")
print("跟踪快速同步... 按Ctrl-C结束")

# 格式化输出
start = 0
while 1:
    (task, pid, cpu, flags, ts, ms) = b.trace_fields()
    if start == 0:
        start = ts
    ts = ts - start
    print("在时间%.2f秒处:检测到多个同步,上次发生在%s毫秒前" % (ts, ms))
- bpf_ktime_get_ns(): 返回时间,单位为纳秒。
- BPF_HASH(last): 创建一个BPF映射对象,类型为哈希(关联数组),名为"last"。我们没有指定其他参数,因此默认的键和值类型为u64。
- key = 0: 我们只会在哈希中存储一个键值对,其中键被硬编码为零。
- last.lookup(&key): 在哈希中查找键,并如果存在则返回其值的指针,否则返回NULL。我们将键作为指针的地址传递给该函数。
- if (tsp != NULL) {: 验证器要求在将从映射查找得到的指针值解引用使用之前,必须先检查其是否为null。1. last.delete(&key): 从哈希表中删除key。目前需要这样做是因为.update()中存在一个内核错误(在4.8.10中已经修复)。
- last.update(&key, &ts): 将第二个参数的值与key关联起来,覆盖之前的任何值。这会记录时间戳。
python"># examples/tracing/sync_timing.py
追踪快速sync... 按Ctrl-C结束"。
4. disksnoop.py
python">[...]
REQ_WRITE = 1  # 来自include/linux/blk_types.h

# 加载BPF程序
b = BPF(text="""
#include <uapi/linux/ptrace.h>
#include <linux/blk-mq.h>

BPF_HASH(start, struct request *);

void trace_start(struct pt_regs *ctx, struct request *req) {
 // 使用请求指针存储开始时间戳
 u64 ts = bpf_ktime_get_ns();

 start.update(&req, &ts);
}

void trace_completion(struct pt_regs *ctx, struct request *req) {
 u64 *tsp, delta;

 tsp = start.lookup(&req);
 if (tsp != 0) {
  delta = bpf_ktime_get_ns() - *tsp;
  bpf_trace_printk("%d %x %d\\n", req->__data_len,
      req->cmd_flags, delta / 1000);
  start.delete(&req);
 }
}
""")
if BPF.get_kprobe_functions(b'blk_start_request'):
        b.attach_kprobe(event="blk_start_request", fn_name="trace_start")
b.attach_kprobe(event="blk_mq_start_request", fn_name="trace_start")
if BPF.get_kprobe_functions(b'__blk_account_io_done'):
    b.attach_kprobe(event="__blk_account_io_done", fn_name="trace_completion") else: b.attach_kprobe(event="blk_account_io_done", fn_name="trace_completion")
    [...]
- REQ_WRITE: 我们在Python程序中定义了一个内核常量,因为我们后面会在Python程序中使用它。如果我们在BPF程序中使用REQ_WRITE,它应该可以正常工作(无需定义),只需使用适当的#includes。
- trace_start(struct pt_regs ctx, struct requestreq): 这个函数将在后面附加到kprobe上。kprobe函数的参数是struct pt_regs ctx,用于寄存器和BPF上下文,然后是函数的实际参数。我们将把它附加到blk_start_request()上,其中第一个参数是struct request。
- start.update(&req, &ts): 我们使用请求结构的指针作为哈希中的键。这在跟踪中很常见。结构体指针是非常好的键,因为它们是唯一的:两个结构体不能具有相同的指针地址。(只需小心何时释放和重用指针。)所以我们实际上是给描述磁盘I/O的请求结构体打上我们自己的时间戳,以便我们可以计时。存储时间戳常用的两个键是结构体指针和线程ID(用于记录函数入口到返回的时间)。
- req->__data_len: 我们在解引用struct request的成员。请参阅内核源代码中对其定义的部分以获得有关哪些成员可用的信息。bcc实际上会将这些表达式重写为一系列bpf_probe_read_kernel()调用。有时bcc无法处理复杂的解引用,此时您需要直接调用bpf_probe_read_kernel()。
python"># disksnoop.py
时间(s)            T  字节     延迟(ms)
16458043.436012    W  4096        3.13
16458043.437326    W  4096        4.44
16458044.126545    R  4096       42.82
16458044.129872    R  4096        3.24
[...]
5. hello_perf_output.py
python">from bcc import BPF

// 定义BPF程序
prog = """
#include <linux/sched.h>

// 在C中定义输出数据结构
struct data_t {
    u32 pid;
    u64 ts;
    char comm[TASK_COMM_LEN];
};
BPF_PERF_OUTPUT(events);

int hello(struct pt_regs *ctx) {
    struct data_t data = {};

    data.pid = bpf_get_current_pid_tgid();
    data.ts = bpf_ktime_get_ns();
    bpf_get_current_comm(&data.comm, sizeof(data.comm));

    events.perf_submit(ctx, &data, sizeof(data));

    return 0;
}
"""

// 加载BPF程序
b = BPF(text=prog)
b.attach_kprobe(event=b.get_syscall_fnname("clone"), fn_name="hello")

//标题
print("%-18s %-16s %-6s %s" % ("TIME(s)", "COMM", "PID", "MESSAGE"))

//处理事件
start = 0
def print_event(cpu, data, size):
    global start
    event = b["events"].event(data)
    if start == 0:
            start = event.ts
    time_s = (float(event.ts - start)) / 1000000000
    print("%-18.9f %-16s %-6d %s" % (time_s, event.comm, event.pid, "你好,perf_output!"))

//循环并回调print_event
b["events"].open_perf_buffer(print_event)
while 1:
    b.perf_buffer_poll()
- struct data_t: 这定义了一个C结构体,我们将用它来从内核传递数据到用户空间。1. BPF_PERF_OUTPUT(events): 这里给我们的输出通道命名为"events"。
- struct data_t data = {};: 创建一个空的data_t结构体,我们将在之后填充它。
- bpf_get_current_pid_tgid(): 返回低32位的进程ID(内核视图中的PID,用户空间中通常被表示为线程ID),以及高32位的线程组ID(用户空间通常认为是PID)。通过直接将其设置为u32,我们丢弃了高32位。应该显示PID还是TGID?对于多线程应用程序,TGID将是相同的,所以如果你想要区分它们,你需要PID。这也是对最终用户期望的一个问题。
- bpf_get_current_comm(): 将当前进程的名称填充到第一个参数的地址中。
- events.perf_submit(): 通过perf环形缓冲区将事件提交给用户空间以供读取。
- def print_event(): 定义一个Python函数来处理从events流中读取的事件。
- b[“events”].event(data): 现在将事件作为一个Python对象获取,该对象是根据C声明自动生成的。
- b[“events”].open_perf_buffer(print_event): 将Python的print_event函数与events流关联起来。
- while 1: b.perf_buffer_poll(): 阻塞等待事件。
python"># hello_perf_output.py
TIME(s)            COMM             PID    MESSAGE
0.000000000        bash             22986  你好,perf_output!
0.021080275        systemd-udevd    484    你好,perf_output!
0.021359520        systemd-udevd    484    你好,perf_output!
0.021590610        systemd-udevd    484    你好,perf_output!
[...]
6. bitehist.py
python">from __future__ import print_function
from bcc import BPF
from time import sleep

# 加载BPF程序
b = BPF(text="""
#include <uapi/linux/ptrace.h>
#include <linux/blkdev.h>

BPF_HISTOGRAM(dist);

int kprobe__blk_account_io_done(struct pt_regs *ctx, struct request *req)
{
 dist.increment(bpf_log2l(req->__data_len / 1024));
 return 0;
}
""")

# 头部
print("跟踪中... 按Ctrl-C结束.")

# 跟踪直到按下Ctrl-C
try:
 sleep(99999999)
except KeyboardInterrupt:
 print()

# 输出
b["dist"].print_log2_hist("kbytes")
- BPF_HISTOGRAM(dist): 定义了一个名为 “dist” 的BPF映射对象,它是一个直方图。
- dist.increment(): 默认情况下,将第一个参数提供的直方图桶索引加1。也可以作为第二个参数传递自定义的增量。
- bpf_log2l(): 返回所提供值的对数值。这将成为我们直方图的索引,这样我们构建了一个以2为底的幂直方图。
- b[“dist”].print_log2_hist(“kbytes”): 以2为底的幂形式打印 “dist” 直方图,列标题为 “kbytes”。这样只有桶计数从内核传输到用户空间,因此效率高。
python"># bitehist.py
跟踪中... 按Ctrl-C结束。
^C
     kbytes          : count     distribution
       0 -> 1        : 3        |                                      |
       2 -> 3        : 0        |                                      |
       4 -> 7        : 211      |**********                            |
       8 -> 15       : 0        |                                      |
      16 -> 31       : 0        |                                      |".32 -> 63       : 0        |                                      |
      64 -> 127      : 1        |                                      |
     128 -> 255      : 800      |**************************************|
7. vfsreadlat.py
python">#!/usr/bin/python
#
# vfsreadlat.py		VFS read latency distribution.
#			For Linux, uses BCC, eBPF. See .c file.
#
# Written as a basic example of a function latency distribution histogram.
#
# USAGE: vfsreadlat.py [interval [count]]
#
# The default interval is 5 seconds. A Ctrl-C will print the partially
# gathered histogram then exit.
#
# Copyright (c) 2015 Brendan Gregg.
# Licensed under the Apache License, Version 2.0 (the "License")
#
# 15-Aug-2015	Brendan Gregg	Created this.

from __future__ import print_function
from bcc import BPF
from time import sleep
from sys import argv

def usage():
	print("USAGE: %s [interval [count]]" % argv[0])
	exit()

# arguments
interval = 5
count = -1
if len(argv) > 1:
	try:
		interval = int(argv[1])
		if interval == 0:
			raise
		if len(argv) > 2:
			count = int(argv[2])
	except:	# also catches -h, --help
		usage()

# load BPF program
b = BPF(src_file = "vfsreadlat.c")
b.attach_kprobe(event="vfs_read", fn_name="do_entry")
b.attach_kretprobe(event="vfs_read", fn_name="do_return")

# header
print("Tracing... Hit Ctrl-C to end.")

# output
loop = 0
do_exit = 0
while (1):
	if count > 0:
		loop += 1
		if loop > count:
			exit()
	try:
		sleep(interval)
	except KeyboardInterrupt:
		pass; do_exit = 1

	print()
	b["dist"].print_log2_hist("usecs")
	b["dist"].clear()
	if do_exit:
		exit()
vfsreadlat.c
python">#include <uapi/linux/ptrace.h>

BPF_HASH(start, u32);
BPF_HISTOGRAM(dist);

int do_entry(struct pt_regs *ctx)
{
	u32 pid;
	u64 ts;

	pid = bpf_get_current_pid_tgid();
	ts = bpf_ktime_get_ns();
	start.update(&pid, &ts);
	return 0;
}

int do_return(struct pt_regs *ctx)
{
	u32 pid;
	u64 *tsp, delta;

	pid = bpf_get_current_pid_tgid();
	tsp = start.lookup(&pid);

	if (tsp != 0) {
		delta = bpf_ktime_get_ns() - *tsp;
		dist.increment(bpf_log2l(delta / 1000));
		start.delete(&pid);
	}

	return 0;
}
- b = BPF(src_file = “vfsreadlat.c”): 从一个单独的C语言文件读取程序。
- b.attach_kretprobe(event=“vfs_read”, fn_name=“do_return”): 将BPF C函数do_return() 添加到内核函数 vfs_read()的返回点kprobe钩子中,也就是kretprobe:跟踪的是一个内核函数的返回点,而非进入点。
- b[“dist”].clear(): 清除histogram.
python"># ./vfsreadlat.py 1
Tracing... Hit Ctrl-C to end.
     usecs               : count     distribution
         0 -> 1          : 0        |                                        |
         2 -> 3          : 2        |***********                             |
         4 -> 7          : 7        |****************************************|
         8 -> 15         : 4        |**********************                  |

     usecs               : count     distribution
         0 -> 1          : 29       |****************************************|
         2 -> 3          : 28       |**************************************  |
         4 -> 7          : 4        |*****                                   |
         8 -> 15         : 8        |***********                             |
        16 -> 31         : 0        |                                        |
        32 -> 63         : 0        |                                        |
        64 -> 127        : 0        |                                        |
       128 -> 255        : 0        |                                        |
       256 -> 511        : 2        |**                                      |
       512 -> 1023       : 0        |                                        |
      1024 -> 2047       : 0        |                                        |
      2048 -> 4095       : 0        |                                        |
      4096 -> 8191       : 4        |*****                                   |
      8192 -> 16383      : 6        |********                                |
     16384 -> 32767      : 9        |************                            |
     32768 -> 65535      : 6        |********                                |
     65536 -> 131071     : 2        |**                                      |

     usecs               : count     distribution
         0 -> 1          : 11       |****************************************|
         2 -> 3          : 2        |*******                                 |
         4 -> 7          : 10       |************************************    |
         8 -> 15         : 8        |*****************************           |
        16 -> 31         : 1        |***                                     |
        32 -> 63         : 2        |*******                                 |
[...]
8. urandomread.py
python">from __future__ import print_function
from bcc import BPF

# load BPF program
b = BPF(text="""
TRACEPOINT_PROBE(random, urandom_read) {
    // args is from /sys/kernel/debug/tracing/events/random/urandom_read/format
    bpf_trace_printk("%d\\n", args->got_bits);
    return 0;
}
""")

# header
print("%-18s %-16s %-6s %s" % ("TIME(s)", "COMM", "PID", "GOTBITS"))

# format output
while 1:
    try:
        (task, pid, cpu, flags, ts, msg) = b.trace_fields()
    except ValueError:
        continue
    print("%-18.9f %-16s %-6d %s" % (ts, task, pid, msg))
- TRACEPOINT_PROBE(random, urandom_read): 跟踪内核tracepoint函数random:urandom_read。由于tracepoint的API比较稳定,一般不会轻易修改;因而相较于kprobe,只要能够使用tracepoint就尽量选择tracepoint跟踪。可以通过perf list命令来列出有哪些可用的tracepoints。在Linux >= 4.7 的版本中要求将BPF 程序 attach 到tracepoints。
- args->got_bits: args 是自动生成的,其类型为tracepoint参数类型数据结构。上
python"># ./urandomread.py
TIME(s)            COMM             PID    GOTBITS
24652832.956994001 smtp             24690  384
24652837.726500999 dd               24692  65536
24652837.727111001 dd               24692  65536
24652837.727703001 dd               24692  65536
24652837.728294998 dd               24692  65536
24652837.728888001 dd               24692  65536
9. strlen_count.py
python">from __future__ import print_function
from bcc import BPF
from time import sleep

# load BPF program
b = BPF(text="""
#include <uapi/linux/ptrace.h>

struct key_t {
    char c[80];
};
BPF_HASH(counts, struct key_t);

int count(struct pt_regs *ctx) {
    if (!PT_REGS_PARM1(ctx))
        return 0;

    struct key_t key = {};
    u64 zero = 0, *val;

    bpf_probe_read_user(&key.c, sizeof(key.c), (void *)PT_REGS_PARM1(ctx));
    // could also use `counts.increment(key)`
    val = counts.lookup_or_try_init(&key, &zero);
    if (val) {
      (*val)++;
    }
    return 0;
};
""")
b.attach_uprobe(name="c", sym="strlen", fn_name="count")

# header
print("Tracing strlen()... Hit Ctrl-C to end.")

# sleep until Ctrl-C
try:
    sleep(99999999)
except KeyboardInterrupt:
    pass

# print output
print("%10s %s" % ("COUNT", "STRING"))
counts = b.get_table("counts")
for k, v in sorted(counts.items(), key=lambda counts: counts[1].value):
    print("%10d \"%s\"" % (v.value, k.c.encode('string-escape')))
- PT_REGS_PARM1(ctx): 这个宏用于获取被跟踪函数strlen()的第一个参数,也就是要处理的字符串。
- b.attach_uprobe(name=“c”, sym=“strlen”, fn_name=“count”):Attach "c"库(if this is the main program, use its pathname),跟踪其用户态函数strlen(),并在strlen()函数执行时调用我们的挂接的uprobe函数count()。
python"># ./strlen_count.py
Tracing strlen()... Hit Ctrl-C to end.
^C     COUNT STRING
         1 " "
         1 "/bin/ls"
         1 "."
         1 "cpudist.py.1"
         1 ".bashrc"
         1 "ls --color=auto"
         1 "key_t"
[...]
        10 "a7:~# "
        10 "/root"
        12 "LC_ALL"
        12 "en_US.UTF-8"
        13 "en_US.UTF-8"
        20 "~"
        70 "#%^,~:-=?+/}"
       340 "\x01\x1b]0;root@bgregg-test: ~\x07\x02root@bgregg-test:~# "
10. nodejs_http_server.py
python">from __future__ import print_function
from bcc import BPF, USDT
import sys

if len(sys.argv) < 2:
    print("USAGE: nodejs_http_server PID")
    exit()
pid = sys.argv[1]
debug = 0

# load BPF program
bpf_text = """
#include <uapi/linux/ptrace.h>
int do_trace(struct pt_regs *ctx) {
    uint64_t addr;
    char path[128]={0};
    bpf_usdt_readarg(6, ctx, &addr);
    bpf_probe_read_user(&path, sizeof(path), (void *)addr);
    bpf_trace_printk("path:%s\\n", path);
    return 0;
};
"""

# enable USDT probe from given PID
u = USDT(pid=int(pid))
u.enable_probe(probe="http__server__request", fn_name="do_trace")
if debug:
    print(u.get_text())
    print(bpf_text)

# initialize BPF
b = BPF(text=bpf_text, usdt_contexts=[u])
- bpf_usdt_readarg(6, ctx, &addr): 从USDT probe中读取第6个参数地址到addr中。
- bpf_probe_read_user(&path, sizeof(path), (void *)addr):现在将addr 指向path。
- u = USDT(pid=int(pid)): 使用指定的PID初始化USDT tracing。
- u.enable_probe(probe=“http__server__request”, fn_name=“do_trace”): 将我们的BPF C函数do_trace() 添加到USDT探测点Node.js的http__server__request 处。
- b = BPF(text=bpf_text, usdt_contexts=[u]): 需要将我们的USDT对象"u"传入到BPF对象的创建函数中。
python"># ./nodejs_http_server.py 24728
TIME(s)            COMM             PID    ARGS
24653324.561322998 node             24728  path:/index.html
24653335.343401998 node             24728  path:/images/welcome.png
24653340.510164998 node             24728  path:/images/favicon.png
11. task_switch.c
这个程序会在每次任务切换时被调用,它会把新/老任务的pids记录到BPF map中。
下面这段C程序引入了一个新概念: 参数 prev。这个参数由BCC前端进行特殊处理,因此对该变量的访问是从kprobe基础结构传递的已保存上下文中获取。从位置1开始的参数的原型应该与正在被探测的内核函数的原型匹配。这样一来程序就对函数参数的访问权无缝对接。
python">#include <uapi/linux/ptrace.h>
#include <linux/sched.h>

struct key_t {
    u32 prev_pid;
    u32 curr_pid;
};

BPF_HASH(stats, struct key_t, u64, 1024);
int count_sched(struct pt_regs *ctx, struct task_struct *prev) {
    struct key_t key = {};
    u64 zero = 0, *val;

    key.curr_pid = bpf_get_current_pid_tgid();
    key.prev_pid = prev->pid;

    // could also use `stats.increment(key);`
    val = stats.lookup_or_try_init(&key, &zero);
    if (val) {
      (*val)++;
    }
    return 0;
}
用户态组件加载上面文件的内容并attache到finish_task_switch()内核函数的kprobe探测钩子中。 通过[]这个操作将可以访问到程序中BPF对象中BPF_HASH元素,这样就可以直接访问到内核中的变量。使用这个对象就像python中的其他对象一样:read, update, and deletes 等等内置的函数都是标准配置。
python">from bcc import BPF
from time import sleep

b = BPF(src_file="task_switch.c")
b.attach_kprobe(event="finish_task_switch", fn_name="count_sched")

# generate many schedule events
for i in range(0, 100): sleep(0.01)

for k, v in b["stats"].items():
    print("task_switch[%5d->%5d]=%u" % (k.prev_pid, k.curr_pid, v.value))
12. 监视 do_execve
python">// do_execve.c
#include <uapi/linux/limits.h>		// #define NAME_MAX		255
#include <linux/fs.h>			// struct filename;
#include <linux/sched.h>		// #define TASK_COMM_LEN	16

// 定义 Buffer 中的数据结构,用于内核态和用户态的数据交换
struct data_t {
	u32     pid;
	char    comm[TASK_COMM_LEN];
	char    fname[NAME_MAX];
};
BPF_PERF_OUTPUT(events);
// 自定义 hook 函数
int check_do_execve(struct pt_regs *ctx, struct filename *filename,
                                const char __user *const __user *__argv,
                                const char __user *const __user *__envp) {
	truct data_t data = { };

	data.pid = bpf_get_current_pid_tgid();
	bpf_get_current_comm(&data.comm, sizeof(data.comm));
	bpf_probe_read_kernel_str(&data.fname, sizeof(data.fname), (void *)filename->name);
	// 提交 buffer 数据
	events.perf_submit(ctx, &data, sizeof(data));
	return 0;
}
python"># do_execve.py
#!/bin/python3
from bcc import BPF
from bcc.utils import printb
# 指定 eBPF 源码文件
b = BPF(src_file="do_execve.c")
# 以内核函数的方式绑定 eBPF 探针
b.attach_kprobe(event="do_execve", fn_name="check_do_execve")

print("%-6s %-16s %-16s" % ("PID", "COMM", "FILE"))
# 自定义回调函数
def print_event(cpu, data, size):
	event = b["events"].event(data)
	printb(b"%-6d %-16s %-16s" % (event.pid, event.comm, event.fname))

# 指定 buffer 名称,为 buffer 的修改添加回调函数
b["events"].open_perf_buffer(print_event)
while 1:
	try:
		# 循环监听
		b.perf_buffer_poll()
	except KeyboardInterrupt:
		exit()
1)首先,对 eBPF BCC 程序的用户态和内核态代码进行拆分,并在用户态程序中,通过 b = BPF(src_file=“do_execve.c”) 对内核态源码文件进行绑定。
2)以内核函数的方式绑定 eBPF 程序,绑定点为 do_execve(),自定义处理函数为 check_do_execve()。
check_do_execve() 函数的参数分为两部分:
python">① struct pt_regs *ctx;
② struct filename *filename, const char __user *const __user *__argv, const char __user *const __user *__envp
这是因为,②所代表的,正是内核 do_execve()函数的参数。do_execve()函数签名如下:
python">// fs/exec.c
int do_execve(struct filename *filename, const char __user *const __user *__argv, const char __user *const __user *__envp) {...}
是的,通过这种方式,几乎可以监控任意一个内核中的函数。
3)内核态程序中,使用了一些 eBPF Helper 函数来进行一些基础的操作和数据获取,例如:
python">bpf_get_current_pid_tgid()								// 获取当前进程 pid
bpf_get_current_comm(&data.comm, sizeof(data.comm));					// 获取当前进程名 comm
bpf_probe_read_kernel_str(&data.fname, sizeof(data.fname), (void *)filename->name);	// 将数据从内核空间拷贝到用户空间
4)内核态程序中,使用 BPF_PERF_OUTPUT(events) 声明 buffer 中的共享变量;使用 events.perf_submit(ctx, &data, sizeof(data)) 提交数据。
用户态程序中,使用 b[“events”].open_perf_buffer(print_event) 指定 buffer 名称,为 buffer 的修改添加回调函数 print_event。
运行这段程序,输出如下:
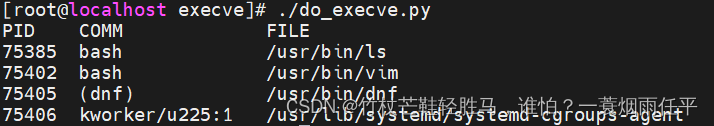
可以看到,这段程序可以实时监控内核进程执行,并输出执行的进程和被执行的文件名。