SpringBoot应用配置Prometheus步骤
- SpringBoot应用依赖要求
- Prometheus
- Grafana
- Grafana监控界面模板
SpringBoot应用依赖要求
<!-- 监控系统健康情况的工具 -->
<dependency>
	<groupId>org.springframework.boot</groupId>
	<artifactId>spring-boot-starter-actuator</artifactId>
</dependency>
<!-- 桥接Prometheus -->
<dependency>
	<groupId>io.micrometer</groupId>
	<artifactId>micrometer-registry-prometheus</artifactId>
	<scope>runtime</scope>
</dependency>
<!-- micrometer 核心包,按需引入,使用 Meter 注解或手动埋点时需要 -->
<dependency>
	<groupId>io.micrometer</groupId>
	<artifactId>micrometer-core</artifactId>
	<version>1.7.6</version>
</dependency>
<!-- micrometer获取JVM相关信息,并展示在Grafana上 -->
<dependency>
	<groupId>io.github.mweirauch</groupId>
	<artifactId>micrometer-jvm-extras</artifactId>
	<version>0.2.2</version>
</dependency>
management:
  metrics:
    tags:
      appname: ${spring.application.name}
  endpoints:
    web:
      exposure:
        include: "*"
        exclude: "env,beans"
SpringBoot2.1/Micrometer 1.1.0版本以上添加这行配置
management.metrics.tags.application: ${spring.application.name}
其他实现
@Bean
MeterRegistryCustomizer<MeterRegistry> configurer(
    @Value("${spring.application.name}") String applicationName) {
    return (registry) -> registry.config().commonTags("application", applicationName);
}
Prometheus
官网下载地址:https://prometheus.io/download/
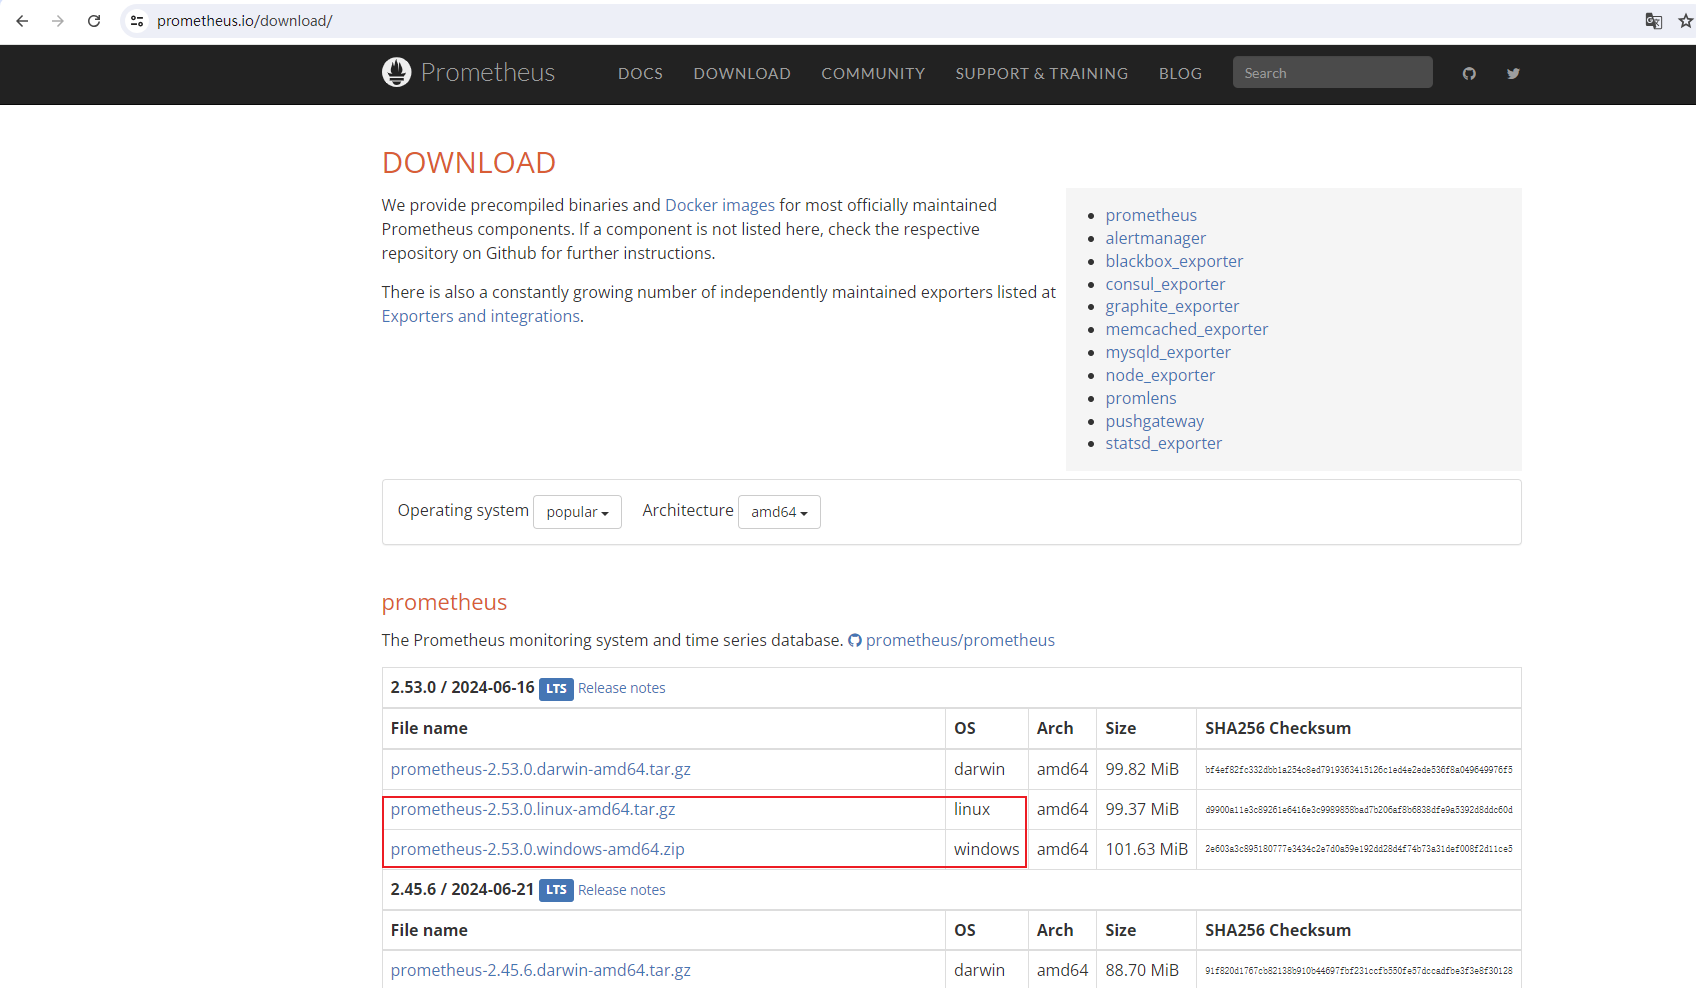
# 解压缩安装
tar zvxf prometheus-2.53.0.linux-amd64.tar.gz

cd prometheus-2.53.0.linux-amd64

# 读取指定yml配置启动,以8090端口启动
./prometheus --config.file=prometheus.yml --web.listen-address=:8090

nohup ./prometheus --config.file=prometheus.yml --web.listen-address=:8090  > ./logs/prometheus.log 2>&1 &
# 全局配置
global:
  scrape_interval: 15s # 控制prometheus抓取数据的频率,默认1min。
  evaluation_interval: 15s # 每15秒评估一次规则。默认为每1分钟一次。

alerting:
  alertmanagers:
    - static_configs:
        - targets:
          # - alertmanager:9093


rule_files:

scrape_configs:
  - job_name: "prometheus" # 可以是${spring.application.name}配置的名称,后续结合Grafana会使用到
    # metrics_path: "/actuator/prometheus" 默认后缀地址metrics,SpringBoot应用监听地址需要修改
    static_configs:
      - targets: ["localhost:8090"] # 监听prmetheus自己
# 支持多个应用
可以筛选监听应用的数据
Grafana
官网地址:https://grafana.com/get/?tab=self-managed
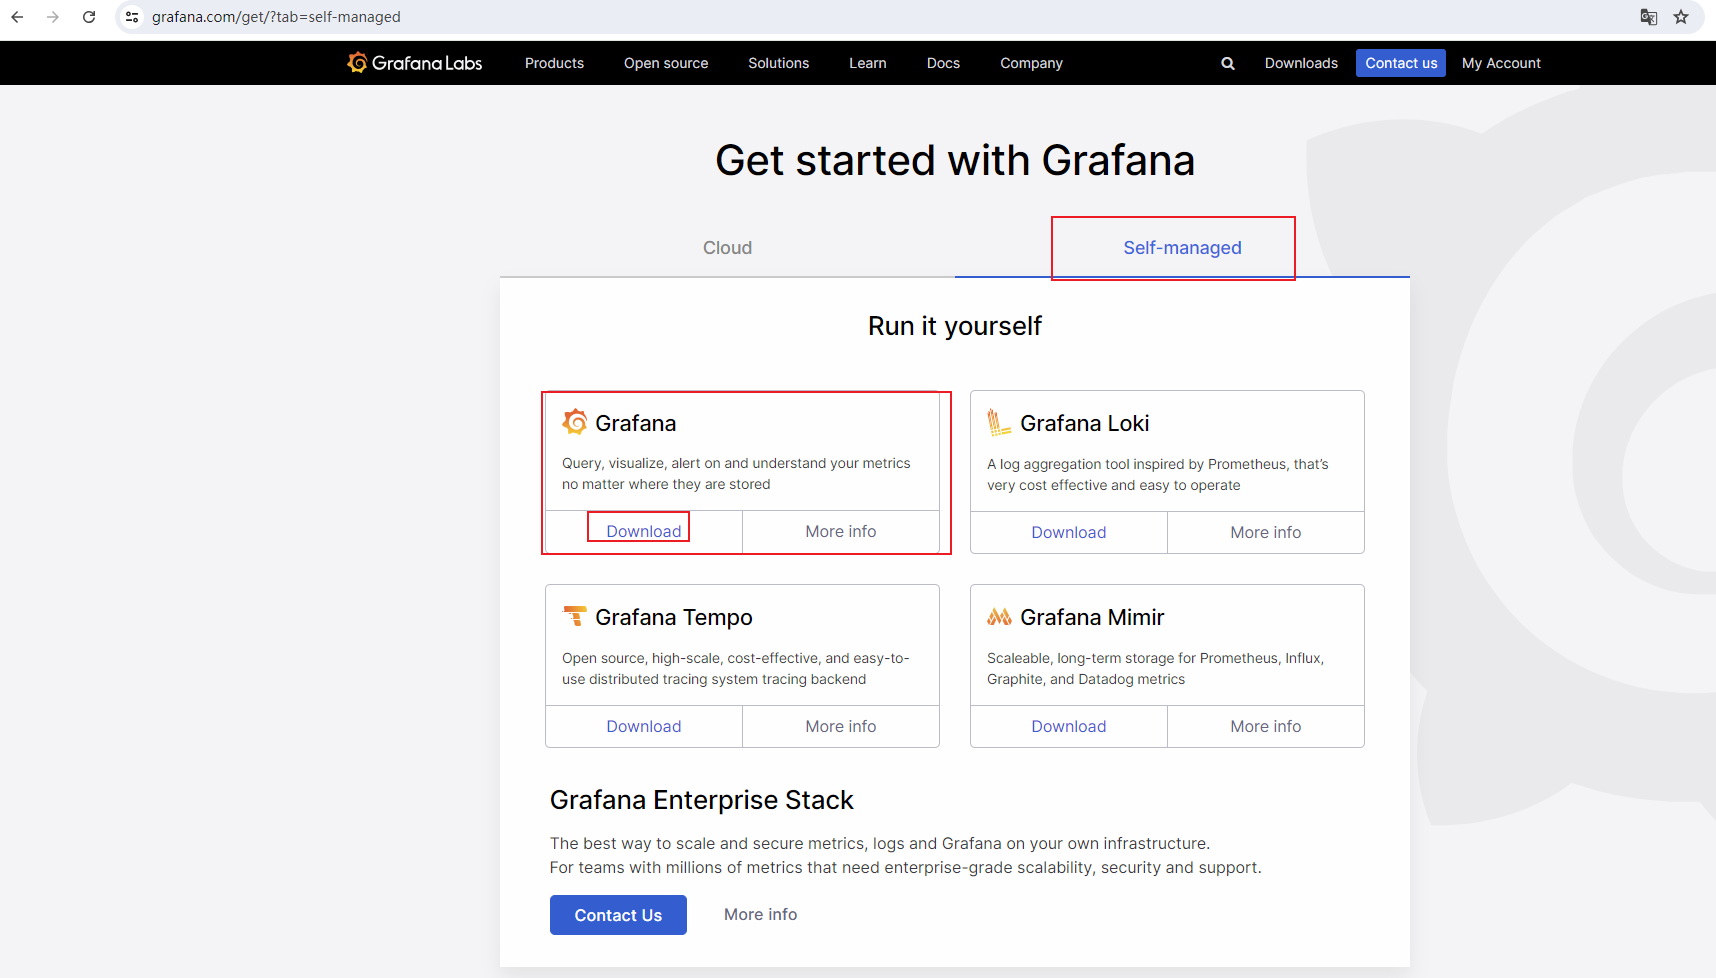
# 解压缩安装安装
wget https://dl.grafana.com/enterprise/release/grafana-enterprise-11.1.0.linux-amd64.tar.gz
tar -zxvf grafana-enterprise-11.1.0.linux-amd64.tar.gz

# 启动
./bin/grafana-server

# http://localhost:3000 访问登录,默认admin/admin
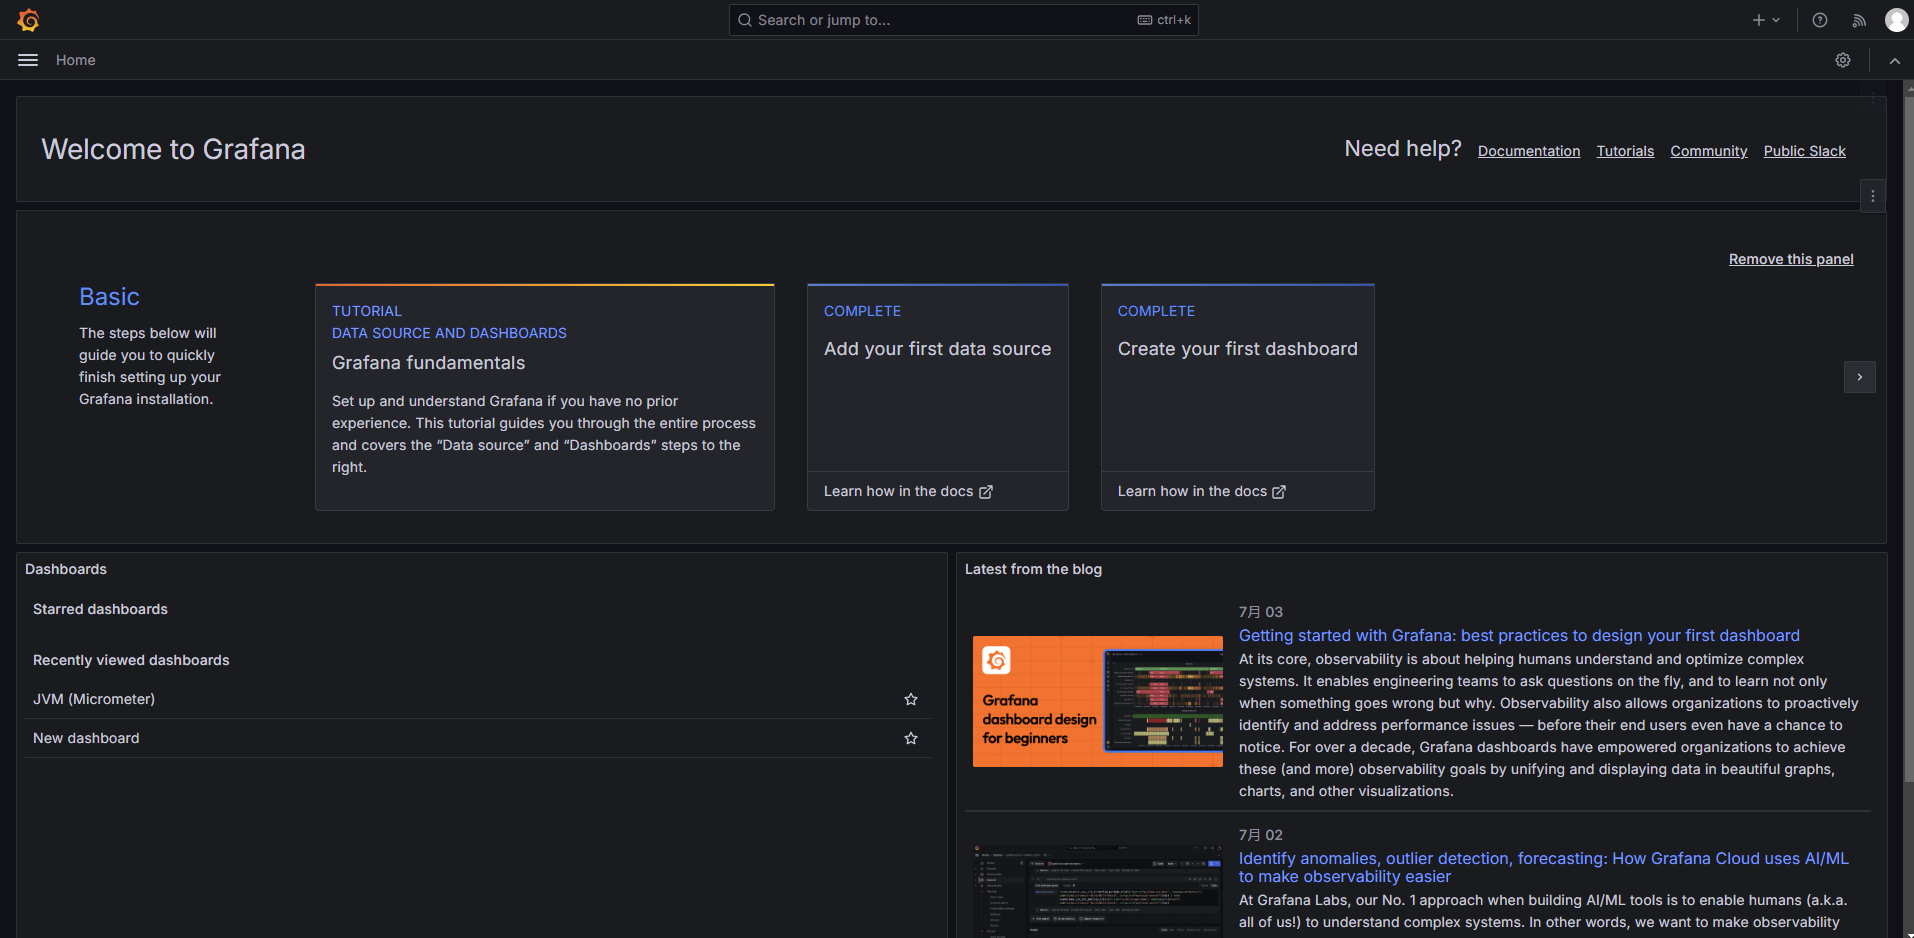
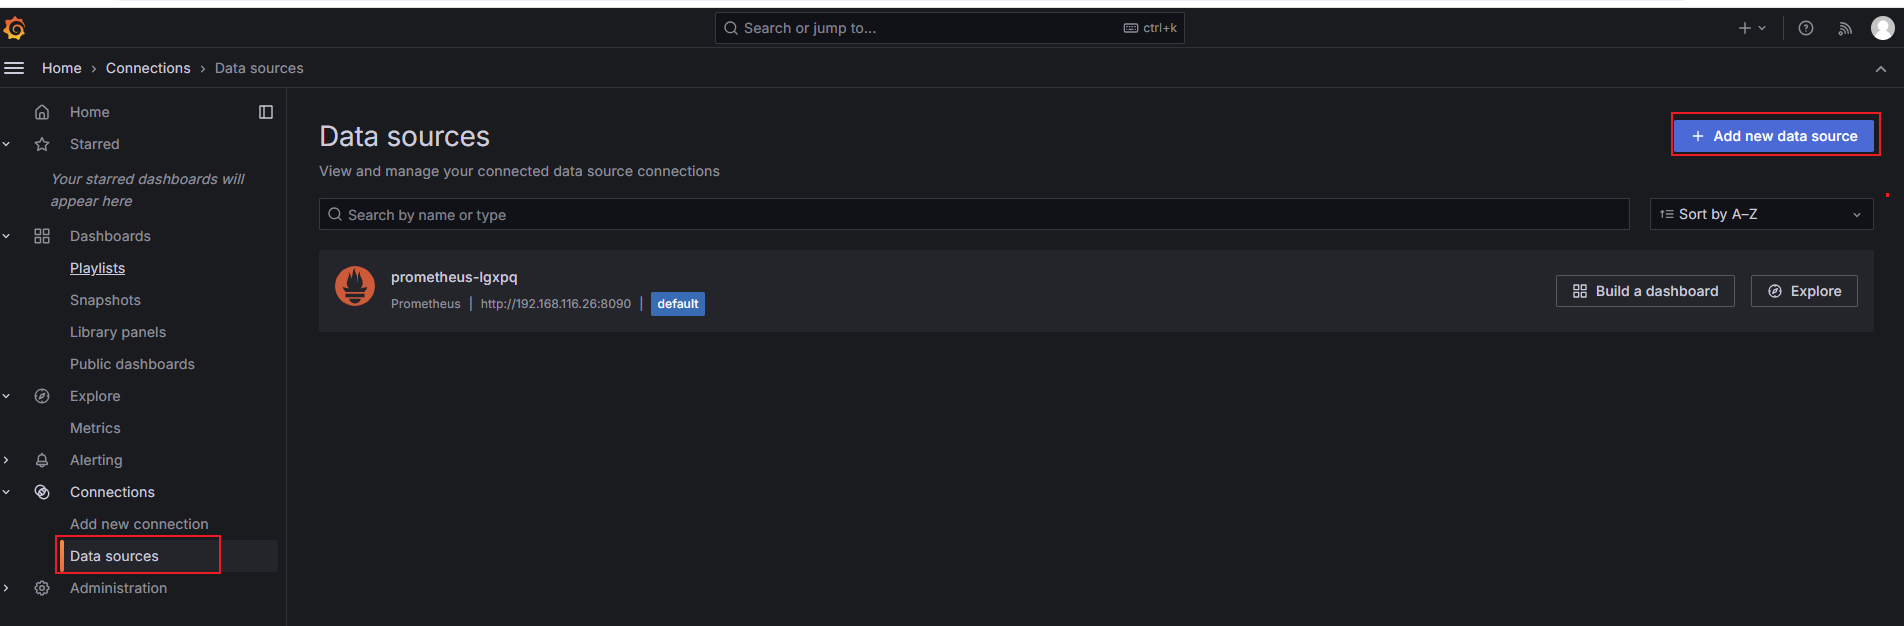
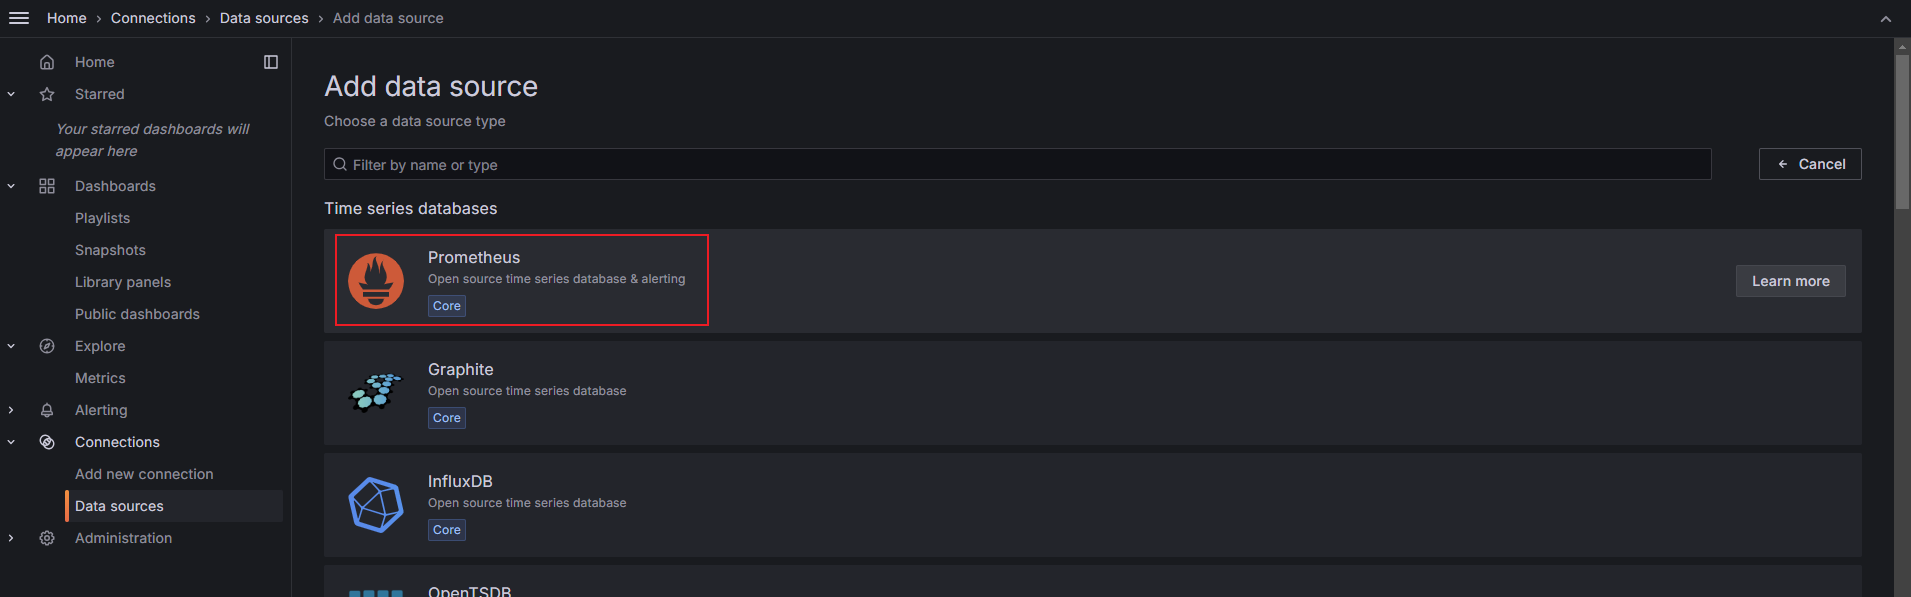
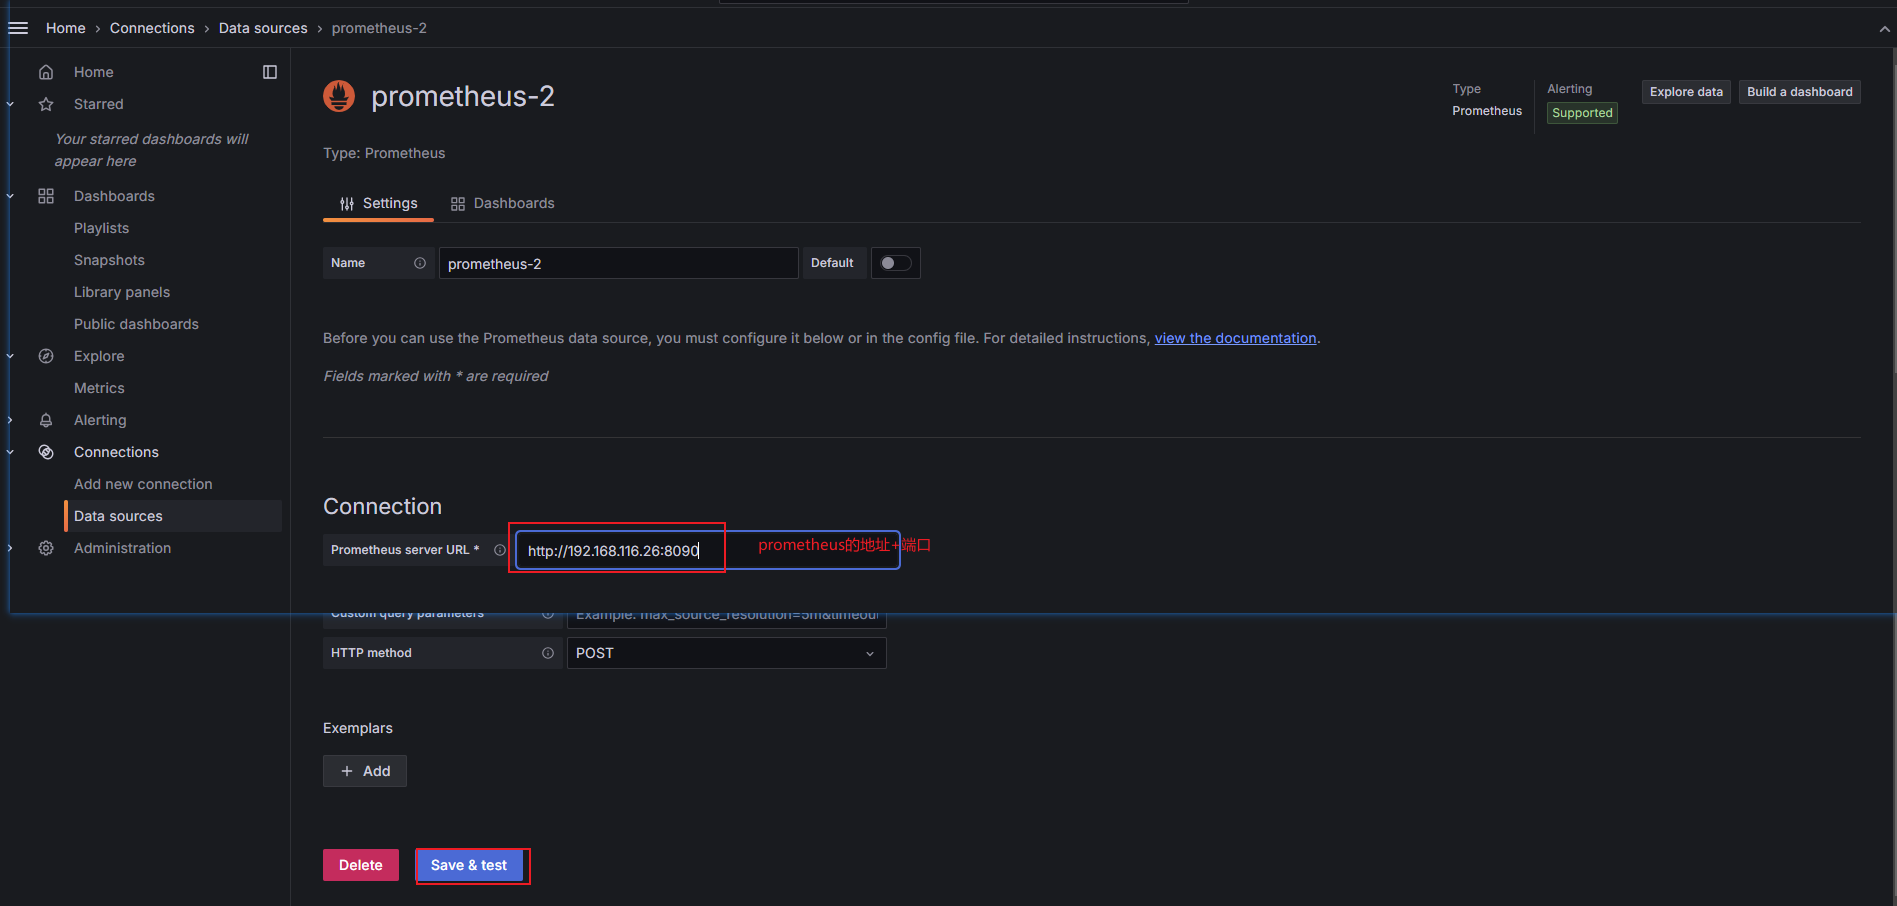
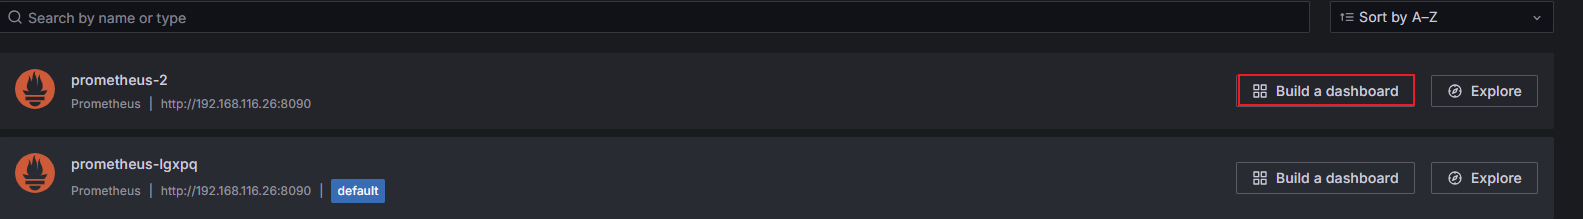
添加数据源
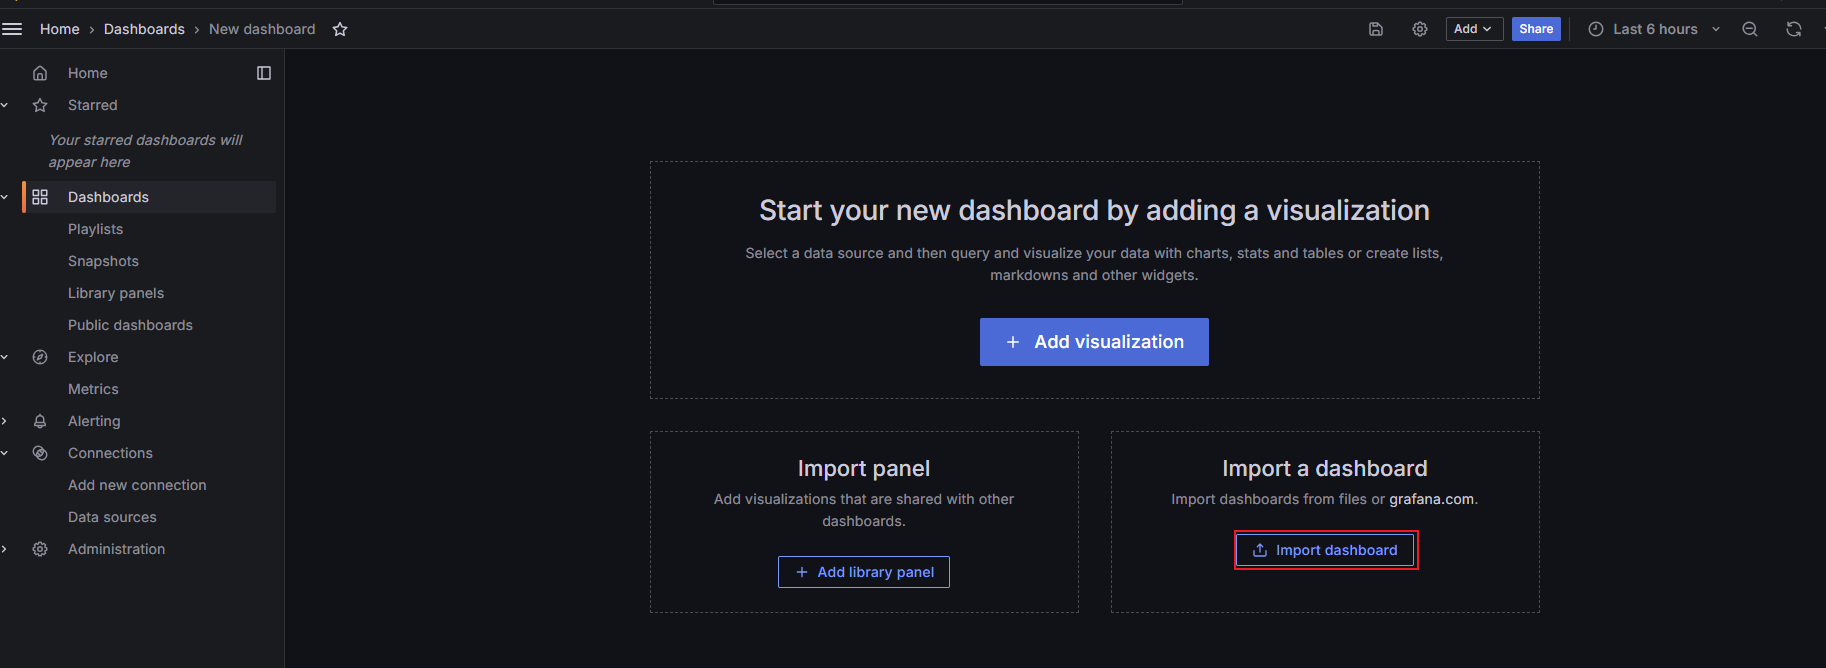
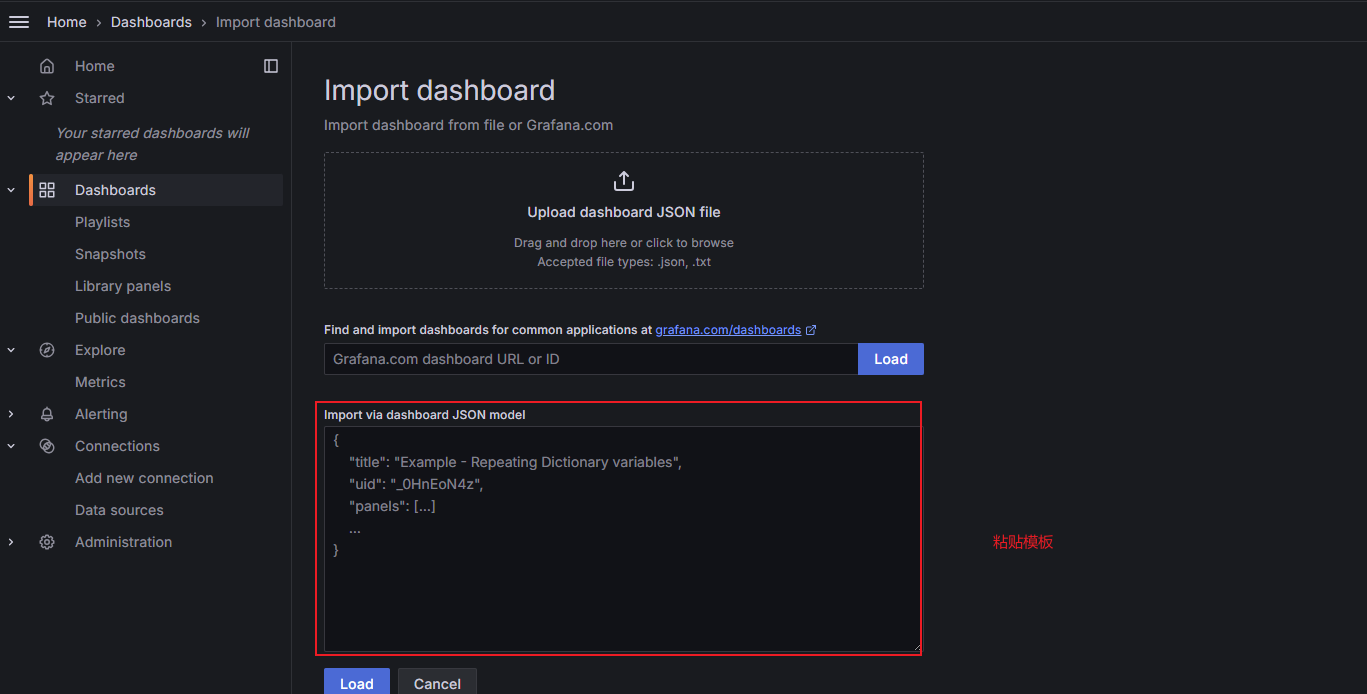
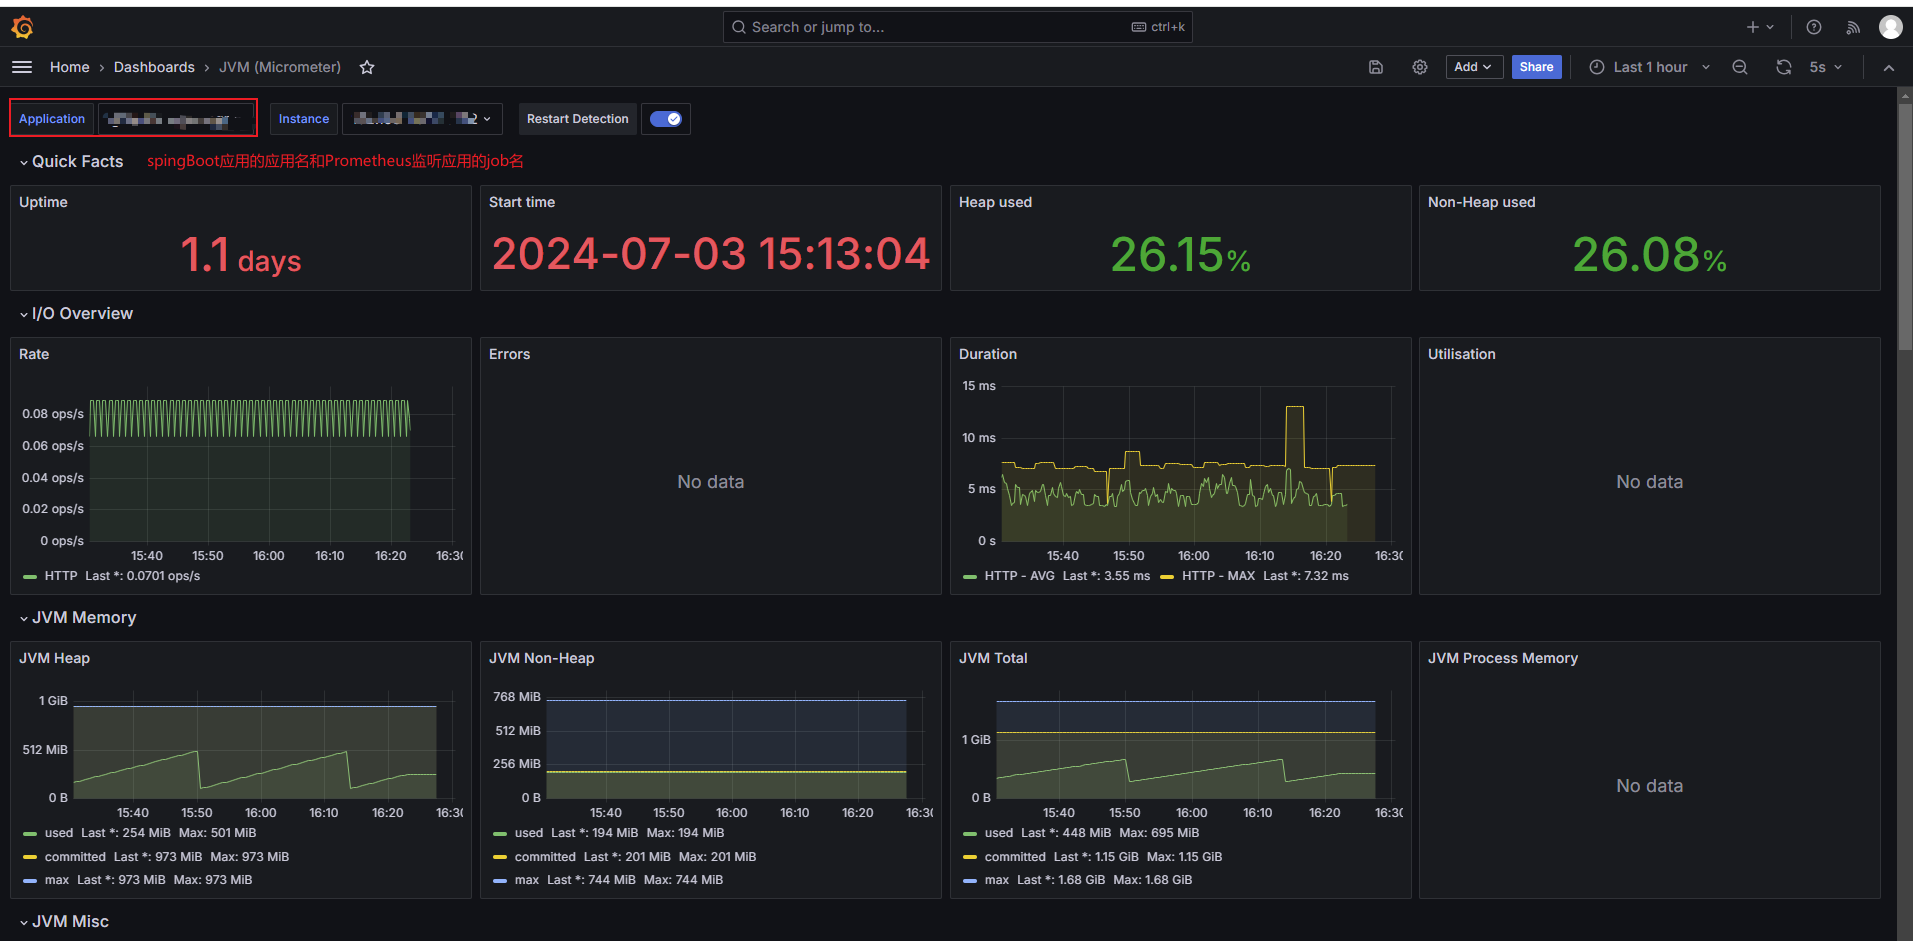
Grafana监控界面模板
JVM模板:https://grafana.com/grafana/dashboards/4701-jvm-micrometer/
配置:4701
{
"__inputs": [
{
"name": "DS_PROMETHEUS",
"label": "Prometheus",
"description": "",
"type": "datasource",
"pluginId": "prometheus",
"pluginName": "Prometheus"
}
],
"__requires": [
{
"type": "grafana",
"id": "grafana",
"name": "Grafana",
"version": "4.6.5"
},
{
"type": "panel",
"id": "graph",
"name": "Graph",
"version": ""
},
{
"type": "datasource",
"id": "prometheus",
"name": "Prometheus",
"version": "1.0.0"
},
{
"type": "panel",
"id": "singlestat",
"name": "Singlestat",
"version": ""
}
],
"annotations": {
"list": [
{
"builtIn": 1,
"datasource": "-- Grafana --",
"enable": true,
"hide": true,
"iconColor": "rgba(0, 211, 255, 1)",
"limit": 100,
"name": "Annotations & Alerts",
"showIn": 0,
"type": "dashboard"
},
{
"datasource": "${DS_PROMETHEUS}",
"enable": true,
"expr": "resets(process_uptime_seconds{application=\"$application\", instance=\"$instance\"}[1m]) > 0",
"iconColor": "rgba(255, 96, 96, 1)",
"name": "Restart Detection",
"showIn": 0,
"step": "1m",
"tagKeys": "restart-tag",
"textFormat": "uptime reset",
"titleFormat": "Restart"
}
]
},
"description": "Dashboard for Micrometer instrumented applications (Java, Spring Boot, Micronaut)",
"editable": true,
"gnetId": 4701,
"graphTooltip": 1,
"hideControls": false,
"id": null,
"links": [],
"refresh": "30s",
"rows": [
{
"collapse": false,
"height": "100px",
"panels": [
{
"cacheTimeout": null,
"colorBackground": false,
"colorValue": true,
"colors": [
"rgba(245, 54, 54, 0.9)",
"rgba(237, 129, 40, 0.89)",
"rgba(50, 172, 45, 0.97)"
],
"datasource": "${DS_PROMETHEUS}",
"decimals": 1,
"editable": true,
"error": false,
"format": "s",
"gauge": {
"maxValue": 100,
"minValue": 0,
"show": false,
"thresholdLabels": false,
"thresholdMarkers": true
},
"height": "",
"id": 63,
"interval": null,
"links": [],
"mappingType": 1,
"mappingTypes": [
{
"name": "value to text",
"value": 1
},
{
"name": "range to text",
"value": 2
}
],
"maxDataPoints": 100,
"nullPointMode": "connected",
"nullText": null,
"postfix": "",
"postfixFontSize": "50%",
"prefix": "",
"prefixFontSize": "70%",
"rangeMaps": [
{
"from": "null",
"text": "N/A",
"to": "null"
}
],
"span": 3,
"sparkline": {
"fillColor": "rgba(31, 118, 189, 0.18)",
"full": false,
"lineColor": "rgb(31, 120, 193)",
"show": false
},
"tableColumn": "",
"targets": [
{
"expr": "process_uptime_seconds{application=\"$application\", instance=\"$instance\"}",
"format": "time_series",
"intervalFactor": 2,
"legendFormat": "",
"metric": "",
"refId": "A",
"step": 14400
}
],
"thresholds": "",
"title": "Uptime",
"transparent": false,
"type": "singlestat",
"valueFontSize": "80%",
"valueMaps": [
{
"op": "=",
"text": "N/A",
"value": "null"
}
],
"valueName": "current"
},
{
"cacheTimeout": null,
"colorBackground": false,
"colorValue": true,
"colors": [
"rgba(245, 54, 54, 0.9)",
"rgba(237, 129, 40, 0.89)",
"rgba(50, 172, 45, 0.97)"
],
"datasource": "${DS_PROMETHEUS}",
"decimals": null,
"editable": true,
"error": false,
"format": "dateTimeAsIso",
"gauge": {
"maxValue": 100,
"minValue": 0,
"show": false,
"thresholdLabels": false,
"thresholdMarkers": true
},
"height": "",
"id": 92,
"interval": null,
"links": [],
"mappingType": 1,
"mappingTypes": [
{
"name": "value to text",
"value": 1
},
{
"name": "range to text",
"value": 2
}
],
"maxDataPoints": 100,
"nullPointMode": "connected",
"nullText": null,
"postfix": "",
"postfixFontSize": "50%",
"prefix": "",
"prefixFontSize": "70%",
"rangeMaps": [
{
"from": "null",
"text": "N/A",
"to": "null"
}
],
"span": 3,
"sparkline": {
"fillColor": "rgba(31, 118, 189, 0.18)",
"full": false,
"lineColor": "rgb(31, 120, 193)",
"show": false
},
"tableColumn": "",
"targets": [
{
"expr": "process_start_time_seconds{application=\"$application\", instance=\"$instance\"}*1000",
"format": "time_series",
"intervalFactor": 2,
"legendFormat": "",
"metric": "",
"refId": "A",
"step": 14400
}
],
"thresholds": "",
"title": "Start time",
"transparent": false,
"type": "singlestat",
"valueFontSize": "70%",
"valueMaps": [
{
"op": "=",
"text": "N/A",
"value": "null"
}
],
"valueName": "current"
},
{
"cacheTimeout": null,
"colorBackground": false,
"colorValue": true,
"colors": [
"rgba(50, 172, 45, 0.97)",
"rgba(237, 129, 40, 0.89)",
"rgba(245, 54, 54, 0.9)"
],
"datasource": "${DS_PROMETHEUS}",
"decimals": 2,
"editable": true,
"error": false,
"format": "percent",
"gauge": {
"maxValue": 100,
"minValue": 0,
"show": false,
"thresholdLabels": false,
"thresholdMarkers": true
},
"id": 65,
"interval": null,
"links": [],
"mappingType": 1,
"mappingTypes": [
{
"name": "value to text",
"value": 1
},
{
"name": "range to text",
"value": 2
}
],
"maxDataPoints": 100,
"nullPointMode": "connected",
"nullText": null,
"postfix": "",
"postfixFontSize": "50%",
"prefix": "",
"prefixFontSize": "70%",
"rangeMaps": [
{
"from": "null",
"text": "N/A",
"to": "null"
}
],
"span": 3,
"sparkline": {
"fillColor": "rgba(31, 118, 189, 0.18)",
"full": false,
"lineColor": "rgb(31, 120, 193)",
"show": false
},
"tableColumn": "",
"targets": [
{
"expr": "sum(jvm_memory_used_bytes{application=\"$application\", instance=\"$instance\", area=\"heap\"})*100/sum(jvm_memory_max_bytes{application=\"$application\",instance=\"$instance\", area=\"heap\"})",
"format": "time_series",
"intervalFactor": 2,
"legendFormat": "",
"refId": "A",
"step": 14400
}
],
"thresholds": "70,90",
"title": "Heap used",
"type": "singlestat",
"valueFontSize": "80%",
"valueMaps": [
{
"op": "=",
"text": "N/A",
"value": "null"
}
],
"valueName": "current"
},
{
"cacheTimeout": null,
"colorBackground": false,
"colorValue": true,
"colors": [
"rgba(50, 172, 45, 0.97)",
"rgba(237, 129, 40, 0.89)",
"rgba(245, 54, 54, 0.9)"
],
"datasource": "${DS_PROMETHEUS}",
"decimals": 2,
"editable": true,
"error": false,
"format": "percent",
"gauge": {
"maxValue": 100,
"minValue": 0,
"show": false,
"thresholdLabels": false,
"thresholdMarkers": true
},
"id": 75,
"interval": null,
"links": [],
"mappingType": 2,
"mappingTypes": [
{
"name": "value to text",
"value": 1
},
{
"name": "range to text",
"value": 2
}
],
"maxDataPoints": 100,
"nullPointMode": "connected",
"nullText": null,
"postfix": "",
"postfixFontSize": "50%",
"prefix": "",
"prefixFontSize": "70%",
"rangeMaps": [
{
"from": "null",
"text": "N/A",
"to": "null"
},
{
"from": "-99999999999999999999999999999999",
"text": "N/A",
"to": "0"
}
],
"span": 3,
"sparkline": {
"fillColor": "rgba(31, 118, 189, 0.18)",
"full": false,
"lineColor": "rgb(31, 120, 193)",
"show": false
},
"tableColumn": "",
"targets": [
{
"expr": "sum(jvm_memory_used_bytes{application=\"$application\", instance=\"$instance\", area=\"nonheap\"})*100/sum(jvm_memory_max_bytes{application=\"$application\",instance=\"$instance\", area=\"nonheap\"})",
"format": "time_series",
"intervalFactor": 2,
"legendFormat": "",
"refId": "A",
"step": 14400
}
],
"thresholds": "70,90",
"title": "Non-Heap used",
"type": "singlestat",
"valueFontSize": "80%",
"valueMaps": [
{
"op": "=",
"text": "N/A",
"value": "null"
},
{
"op": "=",
"text": "x",
"value": ""
}
],
"valueName": "current"
}
],
"repeat": null,
"repeatIteration": null,
"repeatRowId": null,
"showTitle": true,
"title": "Quick Facts",
"titleSize": "h6"
},
{
"collapse": false,
"height": 250,
"panels": [
{
"aliasColors": {},
"bars": false,
"dashLength": 10,
"dashes": false,
"datasource": "${DS_PROMETHEUS}",
"fill": 1,
"id": 111,
"legend": {
"avg": false,
"current": true,
"max": false,
"min": false,
"show": true,
"total": false,
"values": true
},
"lines": true,
"linewidth": 1,
"links": [],
"nullPointMode": "null",
"percentage": false,
"pointradius": 5,
"points": false,
"renderer": "flot",
"seriesOverrides": [],
"spaceLength": 10,
"span": 3,
"stack": false,
"steppedLine": false,
"targets": [
{
"expr": "sum(rate(http_server_requests_seconds_count{application=\"$application\", instance=\"$instance\"}[1m]))",
"format": "time_series",
"intervalFactor": 1,
"legendFormat": "HTTP",
"refId": "A"
}
],
"thresholds": [],
"timeFrom": null,
"timeShift": null,
"title": "Rate",
"tooltip": {
"shared": true,
"sort": 0,
"value_type": "individual"
},
"type": "graph",
"xaxis": {
"buckets": null,
"mode": "time",
"name": null,
"show": true,
"values": []
},
"yaxes": [
{
"decimals": null,
"format": "ops",
"label": null,
"logBase": 1,
"max": null,
"min": "0",
"show": true
},
{
"format": "short",
"label": null,
"logBase": 1,
"max": null,
"min": null,
"show": true
}
]
},
{
"aliasColors": {
"HTTP": "#890f02",
"HTTP - 5xx": "#bf1b00"
},
"bars": false,
"dashLength": 10,
"dashes": false,
"datasource": "${DS_PROMETHEUS}",
"fill": 1,
"id": 112,
"legend": {
"avg": false,
"current": true,
"max": false,
"min": false,
"show": true,
"total": false,
"values": true
},
"lines": true,
"linewidth": 1,
"links": [],
"nullPointMode": "null",
"percentage": false,
"pointradius": 5,
"points": false,
"renderer": "flot",
"seriesOverrides": [],
"spaceLength": 10,
"span": 3,
"stack": false,
"steppedLine": false,
"targets": [
{
"expr": "sum(rate(http_server_requests_seconds_count{application=\"$application\", instance=\"$instance\", status=~\"5..\"}[1m]))",
"format": "time_series",
"intervalFactor": 1,
"legendFormat": "HTTP - 5xx",
"refId": "A"
}
],
"thresholds": [],
"timeFrom": null,
"timeShift": null,
"title": "Errors",
"tooltip": {
"shared": true,
"sort": 0,
"value_type": "individual"
},
"type": "graph",
"xaxis": {
"buckets": null,
"mode": "time",
"name": null,
"show": true,
"values": []
},
"yaxes": [
{
"decimals": null,
"format": "ops",
"label": null,
"logBase": 1,
"max": null,
"min": "0",
"show": true
},
{
"format": "short",
"label": null,
"logBase": 1,
"max": null,
"min": null,
"show": true
}
]
},
{
"aliasColors": {},
"bars": false,
"dashLength": 10,
"dashes": false,
"datasource": "${DS_PROMETHEUS}",
"fill": 1,
"id": 113,
"legend": {
"avg": false,
"current": true,
"max": false,
"min": false,
"show": true,
"total": false,
"values": true
},
"lines": true,
"linewidth": 1,
"links": [],
"nullPointMode": "null",
"percentage": false,
"pointradius": 5,
"points": false,
"renderer": "flot",
"seriesOverrides": [],
"spaceLength": 10,
"span": 3,
"stack": false,
"steppedLine": false,
"targets": [
{
"expr": "sum(rate(http_server_requests_seconds_sum{application=\"$application\", instance=\"$instance\", status!~\"5..\"}[1m]))/sum(rate(http_server_requests_seconds_count{application=\"$application\", instance=\"$instance\", status!~\"5..\"}[1m]))",
"format": "time_series",
"hide": false,
"intervalFactor": 1,
"legendFormat": "HTTP - AVG",
"refId": "A"
},
{
"expr": "max(http_server_requests_seconds_max{application=\"$application\", instance=\"$instance\", status!~\"5..\"})",
"format": "time_series",
"hide": false,
"intervalFactor": 1,
"legendFormat": "HTTP - MAX",
"refId": "B"
}
],
"thresholds": [],
"timeFrom": null,
"timeShift": null,
"title": "Duration",
"tooltip": {
"shared": true,
"sort": 0,
"value_type": "individual"
},
"type": "graph",
"xaxis": {
"buckets": null,
"mode": "time",
"name": null,
"show": true,
"values": []
},
"yaxes": [
{
"format": "s",
"label": null,
"logBase": 1,
"max": null,
"min": "0",
"show": true
},
{
"format": "short",
"label": null,
"logBase": 1,
"max": null,
"min": null,
"show": true
}
]
},
{
"aliasColors": {},
"bars": false,
"dashLength": 10,
"dashes": false,
"datasource": "${DS_PROMETHEUS}",
"description": "",
"fill": 1,
"id": 119,
"legend": {
"alignAsTable": false,
"avg": false,
"current": true,
"max": false,
"min": false,
"show": true,
"total": false,
"values": true
},
"lines": true,
"linewidth": 1,
"links": [],
"nullPointMode": "null",
"percentage": false,
"pointradius": 5,
"points": false,
"renderer": "flot",
"seriesOverrides": [],
"spaceLength": 10,
"span": 3,
"stack": false,
"steppedLine": false,
"targets": [
{
"expr": "tomcat_threads_busy_threads{application=\"$application\", instance=\"$instance\"}",
"format": "time_series",
"hide": false,
"intervalFactor": 2,
"legendFormat": "TOMCAT - BSY",
"refId": "A"
},
{
"expr": "tomcat_threads_current_threads{application=\"$application\", instance=\"$instance\"}",
"format": "time_series",
"hide": false,
"intervalFactor": 2,
"legendFormat": "TOMCAT - CUR",
"refId": "B"
},
{
"expr": "tomcat_threads_config_max_threads{application=\"$application\", instance=\"$instance\"}",
"format": "time_series",
"hide": false,
"intervalFactor": 2,
"legendFormat": "TOMCAT - MAX",
"refId": "C"
},
{
"expr": "jetty_threads_busy{application=\"$application\", instance=\"$instance\"}",
"format": "time_series",
"hide": false,
"intervalFactor": 2,
"legendFormat": "JETTY - BSY",
"refId": "D"
},
{
"expr": "jetty_threads_current{application=\"$application\", instance=\"$instance\"}",
"format": "time_series",
"hide": false,
"intervalFactor": 2,
"legendFormat": "JETTY - CUR",
"refId": "E"
},
{
"expr": "jetty_threads_config_max{application=\"$application\", instance=\"$instance\"}",
"format": "time_series",
"hide": false,
"intervalFactor": 2,
"legendFormat": "JETTY - MAX",
"refId": "F"
}
],
"thresholds": [],
"timeFrom": null,
"timeShift": null,
"title": "Utilisation",
"tooltip": {
"shared": true,
"sort": 0,
"value_type": "individual"
},
"type": "graph",
"xaxis": {
"buckets": null,
"mode": "time",
"name": null,
"show": true,
"values": []
},
"yaxes": [
{
"format": "short",
"label": null,
"logBase": 1,
"max": null,
"min": "0",
"show": true
},
{
"format": "short",
"label": null,
"logBase": 1,
"max": null,
"min": null,
"show": true
}
]
}
],
"repeat": null,
"repeatIteration": null,
"repeatRowId": null,
"showTitle": true,
"title": "I/O Overview",
"titleSize": "h6"
},
{
"collapse": false,
"height": "250px",
"panels": [
{
"aliasColors": {},
"bars": false,
"dashLength": 10,
"dashes": false,
"datasource": "${DS_PROMETHEUS}",
"editable": true,
"error": false,
"fill": 1,
"grid": {
"leftLogBase": 1,
"leftMax": null,
"leftMin": null,
"rightLogBase": 1,
"rightMax": null,
"rightMin": null
},
"id": 24,
"legend": {
"avg": false,
"current": true,
"max": true,
"min": false,
"show": true,
"total": false,
"values": true
},
"lines": true,
"linewidth": 1,
"links": [],
"nullPointMode": "null",
"percentage": false,
"pointradius": 5,
"points": false,
"renderer": "flot",
"seriesOverrides": [],
"spaceLength": 10,
"span": 3,
"stack": false,
"steppedLine": false,
"targets": [
{
"expr": "sum(jvm_memory_used_bytes{application=\"$application\", instance=\"$instance\", area=\"heap\"})",
"format": "time_series",
"intervalFactor": 2,
"legendFormat": "used",
"metric": "",
"refId": "A",
"step": 2400
},
{
"expr": "sum(jvm_memory_committed_bytes{application=\"$application\", instance=\"$instance\", area=\"heap\"})",
"format": "time_series",
"intervalFactor": 2,
"legendFormat": "committed",
"refId": "B",
"step": 2400
},
{
"expr": "sum(jvm_memory_max_bytes{application=\"$application\", instance=\"$instance\", area=\"heap\"})",
"format": "time_series",
"intervalFactor": 2,
"legendFormat": "max",
"refId": "C",
"step": 2400
}
],
"thresholds": [],
"timeFrom": null,
"timeShift": null,
"title": "JVM Heap",
"tooltip": {
"msResolution": false,
"shared": true,
"sort": 0,
"value_type": "cumulative"
},
"type": "graph",
"x-axis": true,
"xaxis": {
"buckets": null,
"mode": "time",
"name": null,
"show": true,
"values": []
},
"y-axis": true,
"y_formats": [
"mbytes",
"short"
],
"yaxes": [
{
"format": "bytes",
"label": null,
"logBase": 1,
"max": null,
"min": 0,
"show": true
},
{
"format": "short",
"label": null,
"logBase": 1,
"max": null,
"min": null,
"show": true
}
]
},
{
"aliasColors": {},
"bars": false,
"dashLength": 10,
"dashes": false,
"datasource": "${DS_PROMETHEUS}",
"editable": true,
"error": false,
"fill": 1,
"grid": {
"leftLogBase": 1,
"leftMax": null,
"leftMin": null,
"rightLogBase": 1,
"rightMax": null,
"rightMin": null
},
"id": 25,
"legend": {
"avg": false,
"current": true,
"max": true,
"min": false,
"show": true,
"total": false,
"values": true
},
"lines": true,
"linewidth": 1,
"links": [],
"nullPointMode": "null",
"percentage": false,
"pointradius": 5,
"points": false,
"renderer": "flot",
"seriesOverrides": [],
"spaceLength": 10,
"span": 3,
"stack": false,
"steppedLine": false,
"targets": [
{
"expr": "sum(jvm_memory_used_bytes{application=\"$application\", instance=\"$instance\", area=\"nonheap\"})",
"format": "time_series",
"interval": "",
"intervalFactor": 2,
"legendFormat": "used",
"metric": "",
"refId": "A",
"step": 2400
},
{
"expr": "sum(jvm_memory_committed_bytes{application=\"$application\", instance=\"$instance\", area=\"nonheap\"})",
"format": "time_series",
"intervalFactor": 2,
"legendFormat": "committed",
"refId": "B",
"step": 2400
},
{
"expr": "sum(jvm_memory_max_bytes{application=\"$application\", instance=\"$instance\", area=\"nonheap\"})",
"format": "time_series",
"intervalFactor": 2,
"legendFormat": "max",
"refId": "C",
"step": 2400
}
],
"thresholds": [],
"timeFrom": null,
"timeShift": null,
"title": "JVM Non-Heap",
"tooltip": {
"msResolution": false,
"shared": true,
"sort": 0,
"value_type": "cumulative"
},
"type": "graph",
"x-axis": true,
"xaxis": {
"buckets": null,
"mode": "time",
"name": null,
"show": true,
"values": []
},
"y-axis": true,
"y_formats": [
"mbytes",
"short"
],
"yaxes": [
{
"format": "bytes",
"label": null,
"logBase": 1,
"max": null,
"min": 0,
"show": true
},
{
"format": "short",
"label": null,
"logBase": 1,
"max": null,
"min": null,
"show": true
}
]
},
{
"aliasColors": {},
"bars": false,
"dashLength": 10,
"dashes": false,
"datasource": "${DS_PROMETHEUS}",
"editable": true,
"error": false,
"fill": 1,
"grid": {
"leftLogBase": 1,
"leftMax": null,
"leftMin": null,
"rightLogBase": 1,
"rightMax": null,
"rightMin": null
},
"id": 26,
"legend": {
"alignAsTable": false,
"avg": false,
"current": true,
"max": true,
"min": false,
"show": true,
"total": false,
"values": true
},
"lines": true,
"linewidth": 1,
"links": [],
"nullPointMode": "null",
"percentage": false,
"pointradius": 5,
"points": false,
"renderer": "flot",
"seriesOverrides": [],
"spaceLength": 10,
"span": 3,
"stack": false,
"steppedLine": false,
"targets": [
{
"expr": "sum(jvm_memory_used_bytes{application=\"$application\", instance=\"$instance\"})",
"format": "time_series",
"intervalFactor": 2,
"legendFormat": "used",
"metric": "",
"refId": "A",
"step": 2400
},
{
"expr": "sum(jvm_memory_committed_bytes{application=\"$application\", instance=\"$instance\"})",
"format": "time_series",
"intervalFactor": 2,
"legendFormat": "committed",
"refId": "B",
"step": 2400
},
{
"expr": "sum(jvm_memory_max_bytes{application=\"$application\", instance=\"$instance\"})",
"format": "time_series",
"intervalFactor": 2,
"legendFormat": "max",
"refId": "C",
"step": 2400
}
],
"thresholds": [],
"timeFrom": null,
"timeShift": null,
"title": "JVM Total",
"tooltip": {
"msResolution": false,
"shared": true,
"sort": 0,
"value_type": "cumulative"
},
"type": "graph",
"x-axis": true,
"xaxis": {
"buckets": null,
"mode": "time",
"name": null,
"show": true,
"values": []
},
"y-axis": true,
"y_formats": [
"mbytes",
"short"
],
"yaxes": [
{
"format": "bytes",
"label": "",
"logBase": 1,
"max": null,
"min": 0,
"show": true
},
{
"format": "short",
"label": null,
"logBase": 1,
"max": null,
"min": null,
"show": true
}
]
},
{
"aliasColors": {},
"bars": false,
"dashLength": 10,
"dashes": false,
"datasource": "${DS_PROMETHEUS}",
"editable": true,
"error": false,
"fill": 1,
"grid": {
"leftLogBase": 1,
"leftMax": null,
"leftMin": null,
"rightLogBase": 1,
"rightMax": null,
"rightMin": null
},
"id": 86,
"legend": {
"avg": false,
"current": true,
"max": true,
"min": false,
"show": true,
"total": false,
"values": true
},
"lines": true,
"linewidth": 1,
"links": [],
"nullPointMode": "null",
"percentage": false,
"pointradius": 5,
"points": false,
"renderer": "flot",
"seriesOverrides": [],
"spaceLength": 10,
"span": 3,
"stack": false,
"steppedLine": false,
"targets": [
{
"expr": "process_memory_vss_bytes{application=\"$application\", instance=\"$instance\"}",
"format": "time_series",
"hide": true,
"intervalFactor": 2,
"legendFormat": "vss",
"metric": "",
"refId": "A",
"step": 2400
},
{
"expr": "process_memory_rss_bytes{application=\"$application\", instance=\"$instance\"}",
"format": "time_series",
"intervalFactor": 2,
"legendFormat": "rss",
"refId": "B"
},
{
"expr": "process_memory_swap_bytes{application=\"$application\", instance=\"$instance\"}",
"format": "time_series",
"intervalFactor": 2,
"legendFormat": "swap",
"refId": "C"
},
{
"expr": "process_memory_rss_bytes{application=\"$application\", instance=\"$instance\"} + process_memory_swap_bytes{application=\"$application\", instance=\"$instance\"}",
"format": "time_series",
"intervalFactor": 2,
"legendFormat": "total",
"refId": "D"
}
],
"thresholds": [],
"timeFrom": null,
"timeShift": null,
"title": "JVM Process Memory",
"tooltip": {
"msResolution": false,
"shared": true,
"sort": 0,
"value_type": "cumulative"
},
"type": "graph",
"x-axis": true,
"xaxis": {
"buckets": null,
"mode": "time",
"name": null,
"show": true,
"values": []
},
"y-axis": true,
"y_formats": [
"mbytes",
"short"
],
"yaxes": [
{
"format": "bytes",
"label": "",
"logBase": 1,
"max": null,
"min": "0",
"show": true
},
{
"format": "short",
"label": null,
"logBase": 1,
"max": null,
"min": null,
"show": true
}
]
}
],
"repeat": null,
"repeatIteration": null,
"repeatRowId": null,
"showTitle": true,
"title": "JVM Memory",
"titleSize": "h6"
},
{
"collapse": false,
"height": 250,
"panels": [
{
"aliasColors": {},
"bars": false,
"dashLength": 10,
"dashes": false,
"datasource": "${DS_PROMETHEUS}",
"editable": true,
"error": false,
"fill": 1,
"grid": {
"leftLogBase": 1,
"leftMax": null,
"leftMin": null,
"rightLogBase": 1,
"rightMax": null,
"rightMin": null
},
"id": 106,
"legend": {
"avg": false,
"current": true,
"max": true,
"min": false,
"show": true,
"total": false,
"values": true
},
"lines": true,
"linewidth": 1,
"links": [],
"nullPointMode": "null",
"percentage": false,
"pointradius": 5,
"points": false,
"renderer": "flot",
"seriesOverrides": [],
"spaceLength": 10,
"span": 3,
"stack": false,
"steppedLine": false,
"targets": [
{
"expr": "system_cpu_usage{application=\"$application\", instance=\"$instance\"}",
"format": "time_series",
"hide": false,
"intervalFactor": 1,
"legendFormat": "system",
"metric": "",
"refId": "A",
"step": 2400
},
{
"expr": "process_cpu_usage{application=\"$application\", instance=\"$instance\"}",
"format": "time_series",
"hide": false,
"intervalFactor": 1,
"legendFormat": "process",
"refId": "B"
},
{
"expr": "avg_over_time(process_cpu_usage{application=\"$application\", instance=\"$instance\"}[15m])",
"format": "time_series",
"hide": false,
"intervalFactor": 1,
"legendFormat": "process-15m",
"refId": "C"
}
],
"thresholds": [],
"timeFrom": null,
"timeShift": null,
"title": "CPU Usage",
"tooltip": {
"msResolution": false,
"shared": true,
"sort": 0,
"value_type": "cumulative"
},
"type": "graph",
"x-axis": true,
"xaxis": {
"buckets": null,
"mode": "time",
"name": null,
"show": true,
"values": []
},
"y-axis": true,
"y_formats": [
"short",
"short"
],
"yaxes": [
{
"decimals": 1,
"format": "percentunit",
"label": "",
"logBase": 1,
"max": "1",
"min": 0,
"show": true
},
{
"format": "short",
"label": null,
"logBase": 1,
"max": null,
"min": null,
"show": true
}
]
},
{
"aliasColors": {},
"bars": false,
"dashLength": 10,
"dashes": false,
"datasource": "${DS_PROMETHEUS}",
"editable": true,
"error": false,
"fill": 1,
"grid": {
"leftLogBase": 1,
"leftMax": null,
"leftMin": null,
"rightLogBase": 1,
"rightMax": null,
"rightMin": null
},
"id": 93,
"legend": {
"avg": false,
"current": true,
"max": true,
"min": false,
"show": true,
"total": false,
"values": true
},
"lines": true,
"linewidth": 1,
"links": [],
"nullPointMode": "null",
"percentage": false,
"pointradius": 5,
"points": false,
"renderer": "flot",
"seriesOverrides": [],
"spaceLength": 10,
"span": 3,
"stack": false,
"steppedLine": false,
"targets": [
{
"expr": "system_load_average_1m{application=\"$application\", instance=\"$instance\"}",
"format": "time_series",
"intervalFactor": 2,
"legendFormat": "system-1m",
"metric": "",
"refId": "A",
"step": 2400
},
{
"expr": "system_cpu_count{application=\"$application\", instance=\"$instance\"}",
"format": "time_series",
"intervalFactor": 2,
"legendFormat": "cpus",
"refId": "B"
}
],
"thresholds": [],
"timeFrom": null,
"timeShift": null,
"title": "Load",
"tooltip": {
"msResolution": false,
"shared": true,
"sort": 0,
"value_type": "cumulative"
},
"type": "graph",
"x-axis": true,
"xaxis": {
"buckets": null,
"mode": "time",
"name": null,
"show": true,
"values": []
},
"y-axis": true,
"y_formats": [
"short",
"short"
],
"yaxes": [
{
"decimals": 1,
"format": "short",
"label": "",
"logBase": 1,
"max": null,
"min": 0,
"show": true
},
{
"format": "short",
"label": null,
"logBase": 1,
"max": null,
"min": null,
"show": true
}
]
},
{
"aliasColors": {},
"bars": false,
"dashLength": 10,
"dashes": false,
"datasource": "${DS_PROMETHEUS}",
"editable": true,
"error": false,
"fill": 1,
"grid": {
"leftLogBase": 1,
"leftMax": null,
"leftMin": null,
"rightLogBase": 1,
"rightMax": null,
"rightMin": null
},
"id": 32,
"legend": {
"avg": false,
"current": true,
"max": true,
"min": false,
"show": true,
"total": false,
"values": true
},
"lines": true,
"linewidth": 1,
"links": [],
"nullPointMode": "null",
"percentage": false,
"pointradius": 5,
"points": false,
"renderer": "flot",
"seriesOverrides": [],
"spaceLength": 10,
"span": 3,
"stack": false,
"steppedLine": false,
"targets": [
{
"expr": "jvm_threads_live_threads{application=\"$application\", instance=\"$instance\"}",
"format": "time_series",
"intervalFactor": 2,
"legendFormat": "live",
"metric": "",
"refId": "A",
"step": 2400
},
{
"expr": "jvm_threads_daemon_threads{application=\"$application\", instance=\"$instance\"}",
"format": "time_series",
"intervalFactor": 2,
"legendFormat": "daemon",
"metric": "",
"refId": "B",
"step": 2400
},
{
"expr": "jvm_threads_peak_threads{application=\"$application\", instance=\"$instance\"}",
"format": "time_series",
"intervalFactor": 2,
"legendFormat": "peak",
"refId": "C",
"step": 2400
},
{
"expr": "process_threads{application=\"$application\", instance=\"$instance\"}",
"format": "time_series",
"interval": "",
"intervalFactor": 2,
"legendFormat": "process",
"refId": "D",
"step": 2400
}
],
"thresholds": [],
"timeFrom": null,
"timeShift": null,
"title": "Threads",
"tooltip": {
"msResolution": false,
"shared": true,
"sort": 0,
"value_type": "cumulative"
},
"type": "graph",
"x-axis": true,
"xaxis": {
"buckets": null,
"mode": "time",
"name": null,
"show": true,
"values": []
},
"y-axis": true,
"y_formats": [
"short",
"short"
],
"yaxes": [
{
"decimals": 0,
"format": "short",
"label": null,
"logBase": 1,
"max": null,
"min": 0,
"show": true
},
{
"format": "short",
"label": null,
"logBase": 1,
"max": null,
"min": null,
"show": true
}
]
},
{
"aliasColors": {
"blocked": "#bf1b00",
"new": "#fce2de",
"runnable": "#7eb26d",
"terminated": "#511749",
"timed-waiting": "#c15c17",
"waiting": "#eab839"
},
"bars": false,
"dashLength": 10,
"dashes": false,
"datasource": "${DS_PROMETHEUS}",
"fill": 1,
"id": 124,
"legend": {
"alignAsTable": false,
"avg": false,
"current": true,
"max": true,
"min": false,
"rightSide": false,
"show": true,
"total": false,
"values": true
},
"lines": true,
"linewidth": 1,
"links": [],
"nullPointMode": "null",
"percentage": false,
"pointradius": 5,
"points": false,
"renderer": "flot",
"seriesOverrides": [],
"spaceLength": 10,
"span": 3,
"stack": false,
"steppedLine": false,
"targets": [
{
"expr": "jvm_threads_states_threads{application=\"$application\", instance=\"$instance\"}",
"format": "time_series",
"intervalFactor": 2,
"legendFormat": "{{state}}",
"refId": "A"
}
],
"thresholds": [],
"timeFrom": null,
"timeShift": null,
"title": "Thread States",
"tooltip": {
"shared": true,
"sort": 0,
"value_type": "individual"
},
"type": "graph",
"xaxis": {
"buckets": null,
"mode": "time",
"name": null,
"show": true,
"values": []
},
"yaxes": [
{
"format": "short",
"label": null,
"logBase": 1,
"max": null,
"min": null,
"show": true
},
{
"format": "short",
"label": null,
"logBase": 1,
"max": null,
"min": null,
"show": true
}
]
},
{
"aliasColors": {},
"bars": false,
"dashLength": 10,
"dashes": false,
"datasource": "${DS_PROMETHEUS}",
"description": "The percent of time spent on Garbage Collection over all CPUs assigned to the JVM process.",
"fill": 1,
"id": 138,
"legend": {
"avg": false,
"current": true,
"max": true,
"min": false,
"show": true,
"total": false,
"values": true
},
"lines": true,
"linewidth": 1,
"links": [],
"nullPointMode": "null",
"percentage": false,
"pointradius": 5,
"points": false,
"renderer": "flot",
"seriesOverrides": [],
"spaceLength": 10,
"span": 3,
"stack": false,
"steppedLine": false,
"targets": [
{
"expr": "sum(rate(jvm_gc_pause_seconds_sum{application=\"$application\", instance=\"$instance\"}[1m])) by (application, instance) / on(application, instance) system_cpu_count",
"format": "time_series",
"intervalFactor": 1,
"legendFormat": "CPU time spent on GC",
"refId": "A"
}
],
"thresholds": [],
"timeFrom": null,
"timeShift": null,
"title": "GC Pressure",
"tooltip": {
"shared": true,
"sort": 0,
"value_type": "individual"
},
"type": "graph",
"xaxis": {
"buckets": null,
"mode": "time",
"name": null,
"show": true,
"values": []
},
"yaxes": [
{
"decimals": 1,
"format": "percentunit",
"label": null,
"logBase": 1,
"max": "1",
"min": "0",
"show": true
},
{
"format": "short",
"label": null,
"logBase": 1,
"max": null,
"min": null,
"show": true
}
]
},
{
"aliasColors": {
"debug": "#1F78C1",
"error": "#BF1B00",
"info": "#508642",
"trace": "#6ED0E0",
"warn": "#EAB839"
},
"bars": false,
"dashLength": 10,
"dashes": false,
"datasource": "${DS_PROMETHEUS}",
"editable": true,
"error": false,
"fill": 1,
"grid": {
"leftLogBase": 1,
"leftMax": null,
"leftMin": null,
"rightLogBase": 1,
"rightMax": null,
"rightMin": null
},
"height": "",
"id": 91,
"legend": {
"alignAsTable": false,
"avg": false,
"current": true,
"hideEmpty": false,
"hideZero": false,
"max": true,
"min": false,
"rightSide": false,
"show": true,
"total": false,
"values": true
},
"lines": true,
"linewidth": 1,
"links": [],
"nullPointMode": "null",
"percentage": true,
"pointradius": 5,
"points": false,
"renderer": "flot",
"seriesOverrides": [
{
"alias": "error",
"yaxis": 1
},
{
"alias": "warn",
"yaxis": 1
}
],
"spaceLength": 10,
"span": 6,
"stack": false,
"steppedLine": false,
"targets": [
{
"expr": "increase(logback_events_total{application=\"$application\", instance=\"$instance\"}[1m])",
"format": "time_series",
"interval": "",
"intervalFactor": 2,
"legendFormat": "{{level}}",
"metric": "",
"refId": "A",
"step": 1200
}
],
"thresholds": [],
"timeFrom": null,
"timeShift": null,
"title": "Log Events",
"tooltip": {
"msResolution": false,
"shared": true,
"sort": 0,
"value_type": "individual"
},
"transparent": false,
"type": "graph",
"x-axis": true,
"xaxis": {
"buckets": null,
"mode": "time",
"name": null,
"show": true,
"values": []
},
"y-axis": true,
"y_formats": [
"short",
"short"
],
"yaxes": [
{
"decimals": 0,
"format": "opm",
"label": null,
"logBase": 1,
"max": null,
"min": "0",
"show": true
},
{
"format": "short",
"label": null,
"logBase": 1,
"max": null,
"min": null,
"show": true
}
]
},
{
"aliasColors": {},
"bars": false,
"dashLength": 10,
"dashes": false,
"datasource": "${DS_PROMETHEUS}",
"editable": true,
"error": false,
"fill": 1,
"grid": {
"leftLogBase": 1,
"leftMax": null,
"leftMin": null,
"rightLogBase": 1,
"rightMax": null,
"rightMin": null
},
"id": 61,
"legend": {
"avg": false,
"current": true,
"max": true,
"min": false,
"show": true,
"total": false,
"values": true
},
"lines": true,
"linewidth": 1,
"links": [],
"nullPointMode": "null",
"percentage": false,
"pointradius": 5,
"points": false,
"renderer": "flot",
"seriesOverrides": [],
"spaceLength": 10,
"span": 3,
"stack": false,
"steppedLine": false,
"targets": [
{
"expr": "process_files_open_files{application=\"$application\", instance=\"$instance\"}",
"format": "time_series",
"hide": false,
"intervalFactor": 2,
"legendFormat": "open",
"metric": "",
"refId": "A",
"step": 2400
},
{
"expr": "process_files_max_files{application=\"$application\", instance=\"$instance\"}",
"format": "time_series",
"hide": false,
"intervalFactor": 2,
"legendFormat": "max",
"metric": "",
"refId": "B",
"step": 2400
}
],
"thresholds": [],
"timeFrom": null,
"timeShift": null,
"title": "File Descriptors",
"tooltip": {
"msResolution": false,
"shared": true,
"sort": 0,
"value_type": "cumulative"
},
"type": "graph",
"x-axis": true,
"xaxis": {
"buckets": null,
"mode": "time",
"name": null,
"show": true,
"values": []
},
"y-axis": true,
"y_formats": [
"short",
"short"
],
"yaxes": [
{
"decimals": 0,
"format": "short",
"label": null,
"logBase": 10,
"max": null,
"min": 0,
"show": true
},
{
"format": "short",
"label": null,
"logBase": 1,
"max": null,
"min": null,
"show": true
}
]
}
],
"repeat": null,
"repeatIteration": null,
"repeatRowId": null,
"showTitle": true,
"title": "JVM Misc",
"titleSize": "h6"
},
{
"collapse": false,
"height": "250px",
"panels": [
{
"aliasColors": {},
"bars": false,
"dashLength": 10,
"dashes": false,
"datasource": "${DS_PROMETHEUS}",
"editable": true,
"error": false,
"fill": 1,
"grid": {
"leftLogBase": 1,
"leftMax": null,
"leftMin": null,
"rightLogBase": 1,
"rightMax": null,
"rightMin": null
},
"id": 3,
"legend": {
"alignAsTable": false,
"avg": false,
"current": true,
"max": true,
"min": false,
"rightSide": false,
"show": true,
"total": false,
"values": true
},
"lines": true,
"linewidth": 1,
"links": [],
"minSpan": 4,
"nullPointMode": "null",
"percentage": false,
"pointradius": 5,
"points": false,
"renderer": "flot",
"repeat": "jvm_memory_pool_heap",
"seriesOverrides": [],
"spaceLength": 10,
"span": 4,
"stack": false,
"steppedLine": false,
"targets": [
{
"expr": "jvm_memory_used_bytes{application=\"$application\", instance=\"$instance\", id=~\"$jvm_memory_pool_heap\"}",
"format": "time_series",
"hide": false,
"interval": "",
"intervalFactor": 2,
"legendFormat": "used",
"metric": "",
"refId": "A",
"step": 1800
},
{
"expr": "jvm_memory_committed_bytes{application=\"$application\", instance=\"$instance\", id=~\"$jvm_memory_pool_heap\"}",
"format": "time_series",
"hide": false,
"interval": "",
"intervalFactor": 2,
"legendFormat": "commited",
"metric": "",
"refId": "B",
"step": 1800
},
{
"expr": "jvm_memory_max_bytes{application=\"$application\", instance=\"$instance\", id=~\"$jvm_memory_pool_heap\"}",
"format": "time_series",
"hide": false,
"interval": "",
"intervalFactor": 2,
"legendFormat": "max",
"metric": "",
"refId": "C",
"step": 1800
}
],
"thresholds": [],
"timeFrom": null,
"timeShift": null,
"title": "$jvm_memory_pool_heap",
"tooltip": {
"msResolution": false,
"shared": true,
"sort": 0,
"value_type": "cumulative"
},
"type": "graph",
"x-axis": true,
"xaxis": {
"buckets": null,
"mode": "time",
"name": null,
"show": true,
"values": []
},
"y-axis": true,
"y_formats": [
"mbytes",
"short"
],
"yaxes": [
{
"format": "bytes",
"label": null,
"logBase": 1,
"max": null,
"min": 0,
"show": true
},
{
"format": "short",
"label": null,
"logBase": 1,
"max": null,
"min": null,
"show": true
}
]
}
],
"repeat": "persistence_counts",
"repeatIteration": null,
"repeatRowId": null,
"showTitle": true,
"title": "JVM Memory Pools (Heap)",
"titleSize": "h6"
},
{
"collapse": false,
"height": 250,
"panels": [
{
"aliasColors": {},
"bars": false,
"dashLength": 10,
"dashes": false,
"datasource": "${DS_PROMETHEUS}",
"editable": true,
"error": false,
"fill": 1,
"grid": {
"leftLogBase": 1,
"leftMax": null,
"leftMin": null,
"rightLogBase": 1,
"rightMax": null,
"rightMin": null
},
"id": 78,
"legend": {
"alignAsTable": false,
"avg": false,
"current": true,
"max": true,
"min": false,
"rightSide": false,
"show": true,
"total": false,
"values": true
},
"lines": true,
"linewidth": 1,
"links": [],
"minSpan": 4,
"nullPointMode": "null",
"percentage": false,
"pointradius": 5,
"points": false,
"renderer": "flot",
"repeat": "jvm_memory_pool_nonheap",
"seriesOverrides": [],
"spaceLength": 10,
"span": 4,
"stack": false,
"steppedLine": false,
"targets": [
{
"expr": "jvm_memory_used_bytes{application=\"$application\", instance=\"$instance\", id=~\"$jvm_memory_pool_nonheap\"}",
"format": "time_series",
"hide": false,
"interval": "",
"intervalFactor": 2,
"legendFormat": "used",
"metric": "",
"refId": "A",
"step": 1800
},
{
"expr": "jvm_memory_committed_bytes{application=\"$application\", instance=\"$instance\", id=~\"$jvm_memory_pool_nonheap\"}",
"format": "time_series",
"hide": false,
"interval": "",
"intervalFactor": 2,
"legendFormat": "commited",
"metric": "",
"refId": "B",
"step": 1800
},
{
"expr": "jvm_memory_max_bytes{application=\"$application\", instance=\"$instance\", id=~\"$jvm_memory_pool_nonheap\"}",
"format": "time_series",
"hide": false,
"interval": "",
"intervalFactor": 2,
"legendFormat": "max",
"metric": "",
"refId": "C",
"step": 1800
}
],
"thresholds": [],
"timeFrom": null,
"timeShift": null,
"title": "$jvm_memory_pool_nonheap",
"tooltip": {
"msResolution": false,
"shared": true,
"sort": 0,
"value_type": "cumulative"
},
"type": "graph",
"x-axis": true,
"xaxis": {
"buckets": null,
"mode": "time",
"name": null,
"show": true,
"values": []
},
"y-axis": true,
"y_formats": [
"mbytes",
"short"
],
"yaxes": [
{
"format": "bytes",
"label": null,
"logBase": 1,
"max": null,
"min": 0,
"show": true
},
{
"format": "short",
"label": null,
"logBase": 1,
"max": null,
"min": null,
"show": true
}
]
}
],
"repeat": null,
"repeatIteration": null,
"repeatRowId": null,
"showTitle": true,
"title": "JVM Memory Pools (Non-Heap)",
"titleSize": "h6"
},
{
"collapse": false,
"height": 250,
"panels": [
{
"aliasColors": {},
"bars": false,
"dashLength": 10,
"dashes": false,
"datasource": "${DS_PROMETHEUS}",
"fill": 1,
"id": 98,
"legend": {
"avg": false,
"current": false,
"max": false,
"min": false,
"show": true,
"total": false,
"values": false
},
"lines": true,
"linewidth": 1,
"links": [],
"nullPointMode": "null",
"percentage": false,
"pointradius": 5,
"points": false,
"renderer": "flot",
"seriesOverrides": [],
"spaceLength": 10,
"span": 4,
"stack": false,
"steppedLine": false,
"targets": [
{
"expr": "rate(jvm_gc_pause_seconds_count{application=\"$application\", instance=\"$instance\"}[1m])",
"format": "time_series",
"hide": false,
"intervalFactor": 1,
"legendFormat": "{{action}} ({{cause}})",
"refId": "A"
}
],
"thresholds": [],
"timeFrom": null,
"timeShift": null,
"title": "Collections",
"tooltip": {
"shared": true,
"sort": 0,
"value_type": "individual"
},
"type": "graph",
"xaxis": {
"buckets": null,
"mode": "time",
"name": null,
"show": true,
"values": []
},
"yaxes": [
{
"format": "ops",
"label": null,
"logBase": 1,
"max": null,
"min": "0",
"show": true
},
{
"format": "short",
"label": "",
"logBase": 1,
"max": null,
"min": null,
"show": true
}
]
},
{
"aliasColors": {},
"bars": false,
"dashLength": 10,
"dashes": false,
"datasource": "${DS_PROMETHEUS}",
"fill": 1,
"id": 101,
"legend": {
"avg": false,
"current": false,
"max": false,
"min": false,
"show": true,
"total": false,
"values": false
},
"lines": true,
"linewidth": 1,
"links": [],
"nullPointMode": "null",
"percentage": false,
"pointradius": 5,
"points": false,
"renderer": "flot",
"seriesOverrides": [],
"spaceLength": 10,
"span": 4,
"stack": false,
"steppedLine": false,
"targets": [
{
"expr": "rate(jvm_gc_pause_seconds_sum{application=\"$application\", instance=\"$instance\"}[1m])/rate(jvm_gc_pause_seconds_count{application=\"$application\", instance=\"$instance\"}[1m])",
"format": "time_series",
"hide": false,
"instant": false,
"intervalFactor": 1,
"legendFormat": "avg {{action}} ({{cause}})",
"refId": "A"
},
{
"expr": "jvm_gc_pause_seconds_max{application=\"$application\", instance=\"$instance\"}",
"format": "time_series",
"hide": false,
"instant": false,
"intervalFactor": 1,
"legendFormat": "max {{action}} ({{cause}})",
"refId": "B"
}
],
"thresholds": [],
"timeFrom": null,
"timeShift": null,
"title": "Pause Durations",
"tooltip": {
"shared": true,
"sort": 0,
"value_type": "individual"
},
"type": "graph",
"xaxis": {
"buckets": null,
"mode": "time",
"name": null,
"show": true,
"values": []
},
"yaxes": [
{
"format": "s",
"label": null,
"logBase": 1,
"max": null,
"min": "0",
"show": true
},
{
"format": "short",
"label": "",
"logBase": 1,
"max": null,
"min": null,
"show": true
}
]
},
{
"aliasColors": {},
"bars": false,
"dashLength": 10,
"dashes": false,
"datasource": "${DS_PROMETHEUS}",
"fill": 1,
"id": 99,
"legend": {
"avg": false,
"current": false,
"max": false,
"min": false,
"show": true,
"total": false,
"values": false
},
"lines": true,
"linewidth": 1,
"links": [],
"nullPointMode": "null",
"percentage": false,
"pointradius": 5,
"points": false,
"renderer": "flot",
"seriesOverrides": [],
"spaceLength": 10,
"span": 4,
"stack": false,
"steppedLine": false,
"targets": [
{
"expr": "rate(jvm_gc_memory_allocated_bytes_total{application=\"$application\", instance=\"$instance\"}[1m])",
"format": "time_series",
"interval": "",
"intervalFactor": 1,
"legendFormat": "allocated",
"refId": "A"
},
{
"expr": "rate(jvm_gc_memory_promoted_bytes_total{application=\"$application\", instance=\"$instance\"}[1m])",
"format": "time_series",
"interval": "",
"intervalFactor": 1,
"legendFormat": "promoted",
"refId": "B"
}
],
"thresholds": [],
"timeFrom": null,
"timeShift": null,
"title": "Allocated/Promoted",
"tooltip": {
"shared": true,
"sort": 0,
"value_type": "individual"
},
"type": "graph",
"xaxis": {
"buckets": null,
"mode": "time",
"name": null,
"show": true,
"values": []
},
"yaxes": [
{
"format": "Bps",
"label": null,
"logBase": 1,
"max": null,
"min": "0",
"show": true
},
{
"format": "short",
"label": null,
"logBase": 1,
"max": null,
"min": null,
"show": true
}
]
}
],
"repeat": null,
"repeatIteration": null,
"repeatRowId": null,
"showTitle": true,
"title": "Garbage Collection",
"titleSize": "h6"
},
{
"collapse": false,
"height": "250px",
"panels": [
{
"aliasColors": {},
"bars": false,
"dashLength": 10,
"dashes": false,
"datasource": "${DS_PROMETHEUS}",
"editable": true,
"error": false,
"fill": 1,
"grid": {
"leftLogBase": 1,
"leftMax": null,
"leftMin": null,
"rightLogBase": 1,
"rightMax": null,
"rightMin": null
},
"id": 37,
"legend": {
"avg": false,
"current": false,
"max": false,
"min": false,
"show": true,
"total": false,
"values": false
},
"lines": true,
"linewidth": 1,
"links": [],
"nullPointMode": "null",
"percentage": false,
"pointradius": 5,
"points": false,
"renderer": "flot",
"seriesOverrides": [],
"spaceLength": 10,
"span": 6,
"stack": false,
"steppedLine": false,
"targets": [
{
"expr": "jvm_classes_loaded_classes{application=\"$application\", instance=\"$instance\"}",
"format": "time_series",
"intervalFactor": 2,
"legendFormat": "loaded",
"metric": "",
"refId": "A",
"step": 1200
}
],
"thresholds": [],
"timeFrom": null,
"timeShift": null,
"title": "Classes loaded",
"tooltip": {
"msResolution": false,
"shared": true,
"sort": 0,
"value_type": "cumulative"
},
"type": "graph",
"x-axis": true,
"xaxis": {
"buckets": null,
"mode": "time",
"name": null,
"show": true,
"values": []
},
"y-axis": true,
"y_formats": [
"short",
"short"
],
"yaxes": [
{
"format": "short",
"label": null,
"logBase": 1,
"max": null,
"min": 0,
"show": true
},
{
"format": "short",
"label": null,
"logBase": 1,
"max": null,
"min": null,
"show": true
}
]
},
{
"aliasColors": {},
"bars": false,
"dashLength": 10,
"dashes": false,
"datasource": "${DS_PROMETHEUS}",
"editable": true,
"error": false,
"fill": 1,
"grid": {
"leftLogBase": 1,
"leftMax": null,
"leftMin": null,
"rightLogBase": 1,
"rightMax": null,
"rightMin": null
},
"id": 38,
"legend": {
"avg": false,
"current": false,
"max": false,
"min": false,
"show": true,
"total": false,
"values": false
},
"lines": true,
"linewidth": 1,
"links": [],
"nullPointMode": "null",
"percentage": false,
"pointradius": 5,
"points": false,
"renderer": "flot",
"seriesOverrides": [],
"spaceLength": 10,
"span": 6,
"stack": false,
"steppedLine": false,
"targets": [
{
"expr": "delta(jvm_classes_loaded_classes{application=\"$application\",instance=\"$instance\"}[1m])",
"format": "time_series",
"hide": false,
"interval": "",
"intervalFactor": 1,
"legendFormat": "delta-1m",
"metric": "",
"refId": "A",
"step": 1200
}
],
"thresholds": [],
"timeFrom": null,
"timeShift": null,
"title": "Class delta",
"tooltip": {
"msResolution": false,
"shared": true,
"sort": 0,
"value_type": "cumulative"
},
"type": "graph",
"x-axis": true,
"xaxis": {
"buckets": null,
"mode": "time",
"name": null,
"show": true,
"values": []
},
"y-axis": true,
"y_formats": [
"ops",
"short"
],
"yaxes": [
{
"decimals": null,
"format": "short",
"label": "",
"logBase": 1,
"max": null,
"min": null,
"show": true
},
{
"format": "short",
"label": null,
"logBase": 1,
"max": null,
"min": null,
"show": true
}
]
}
],
"repeat": null,
"repeatIteration": null,
"repeatRowId": null,
"showTitle": true,
"title": "Classloading",
"titleSize": "h6"
},
{
"collapse": false,
"height": "250px",
"panels": [
{
"aliasColors": {},
"bars": false,
"dashLength": 10,
"dashes": false,
"datasource": "${DS_PROMETHEUS}",
"fill": 1,
"id": 131,
"legend": {
"avg": false,
"current": false,
"max": false,
"min": false,
"show": true,
"total": false,
"values": false
},
"lines": true,
"linewidth": 1,
"links": [],
"minSpan": 4,
"nullPointMode": "null",
"percentage": false,
"pointradius": 5,
"points": false,
"renderer": "flot",
"repeat": "jvm_buffer_pool",
"seriesOverrides": [
{
"alias": "count",
"yaxis": 2
},
{
"alias": "buffers",
"yaxis": 2
}
],
"spaceLength": 10,
"span": 4,
"stack": false,
"steppedLine": false,
"targets": [
{
"expr": "jvm_buffer_memory_used_bytes{application=\"$application\", instance=\"$instance\", id=~\"$jvm_buffer_pool\"}",
"format": "time_series",
"intervalFactor": 2,
"legendFormat": "used",
"refId": "A"
},
{
"expr": "jvm_buffer_total_capacity_bytes{application=\"$application\", instance=\"$instance\", id=~\"$jvm_buffer_pool\"}",
"format": "time_series",
"intervalFactor": 2,
"legendFormat": "capacity",
"refId": "B"
},
{
"expr": "jvm_buffer_count_buffers{application=\"$application\", instance=\"$instance\", id=~\"$jvm_buffer_pool\"}",
"format": "time_series",
"hide": false,
"intervalFactor": 2,
"legendFormat": "buffers",
"refId": "C"
}
],
"thresholds": [],
"timeFrom": null,
"timeShift": null,
"title": "$jvm_buffer_pool",
"tooltip": {
"shared": true,
"sort": 0,
"value_type": "individual"
},
"type": "graph",
"xaxis": {
"buckets": null,
"mode": "time",
"name": null,
"show": true,
"values": []
},
"yaxes": [
{
"format": "decbytes",
"label": null,
"logBase": 1,
"max": null,
"min": "0",
"show": true
},
{
"decimals": 0,
"format": "short",
"label": "",
"logBase": 1,
"max": null,
"min": "0",
"show": true
}
]
}
],
"repeat": null,
"repeatIteration": null,
"repeatRowId": null,
"showTitle": true,
"title": "Buffer Pools",
"titleSize": "h6"
}
],
"schemaVersion": 14,
"style": "dark",
"tags": [],
"templating": {
"list": [
{
"allValue": null,
"current": {},
"datasource": "${DS_PROMETHEUS}",
"hide": 0,
"includeAll": false,
"label": "Application",
"multi": false,
"name": "application",
"options": [],
"query": "label_values(application)",
"refresh": 2,
"regex": "",
"sort": 0,
"tagValuesQuery": "",
"tags": [],
"tagsQuery": "",
"type": "query",
"useTags": false
},
{
"allFormat": "glob",
"allValue": null,
"current": {},
"datasource": "${DS_PROMETHEUS}",
"hide": 0,
"includeAll": false,
"label": "Instance",
"multi": false,
"multiFormat": "glob",
"name": "instance",
"options": [],
"query": "label_values(jvm_memory_used_bytes{application=\"$application\"}, instance)",
"refresh": 2,
"regex": "",
"sort": 0,
"tagValuesQuery": "",
"tags": [],
"tagsQuery": "",
"type": "query",
"useTags": false
},
{
"allFormat": "glob",
"allValue": null,
"current": {},
"datasource": "${DS_PROMETHEUS}",
"hide": 2,
"includeAll": true,
"label": "JVM Memory Pools Heap",
"multi": false,
"multiFormat": "glob",
"name": "jvm_memory_pool_heap",
"options": [],
"query": "label_values(jvm_memory_used_bytes{application=\"$application\", instance=\"$instance\", area=\"heap\"},id)",
"refresh": 1,
"regex": "",
"sort": 1,
"tagValuesQuery": "",
"tags": [],
"tagsQuery": "",
"type": "query",
"useTags": false
},
{
"allFormat": "glob",
"allValue": null,
"current": {},
"datasource": "${DS_PROMETHEUS}",
"hide": 2,
"includeAll": true,
"label": "JVM Memory Pools Non-Heap",
"multi": false,
"multiFormat": "glob",
"name": "jvm_memory_pool_nonheap",
"options": [],
"query": "label_values(jvm_memory_used_bytes{application=\"$application\", instance=\"$instance\", area=\"nonheap\"},id)",
"refresh": 1,
"regex": "",
"sort": 2,
"tagValuesQuery": "",
"tags": [],
"tagsQuery": "",
"type": "query",
"useTags": false
},
{
"allFormat": "glob",
"allValue": null,
"current": {},
"datasource": "${DS_PROMETHEUS}",
"hide": 2,
"includeAll": true,
"label": "JVM Buffer Pools",
"multi": false,
"multiFormat": "glob",
"name": "jvm_buffer_pool",
"options": [],
"query": "label_values(jvm_buffer_memory_used_bytes{application=\"$application\", instance=\"$instance\"},id)",
"refresh": 1,
"regex": "",
"sort": 1,
"tagValuesQuery": "",
"tags": [],
"tagsQuery": "",
"type": "query",
"useTags": false
}
]
},
"time": {
"from": "now-24h",
"to": "now"
},
"timepicker": {
"now": true,
"refresh_intervals": [
"5s",
"10s",
"30s",
"1m",
"5m",
"15m",
"30m",
"1h",
"2h",
"1d"
],
"time_options": [
"5m",
"15m",
"1h",
"6h",
"12h",
"24h",
"2d",
"7d",
"30d"
]
},
"timezone": "browser",
"title": "JVM (Micrometer)",
"version": 33
}

![AGI 之 【Hugging Face】 的【Transformer】的 [ Transformer 架构 ] / [ 编码器 ]的简单整理](https://img-blog.csdnimg.cn/direct/15ee1c3725ec414bb1f0864b4892249c.jpeg)